

The brain functional connectome is robustly altered by lack of sleep
- PMID: 26712339
- PMCID: PMC6600874
- DOI: 10.1016/j.neuroimage.2015.12.028
The brain functional connectome is robustly altered by lack of sleep
Abstract
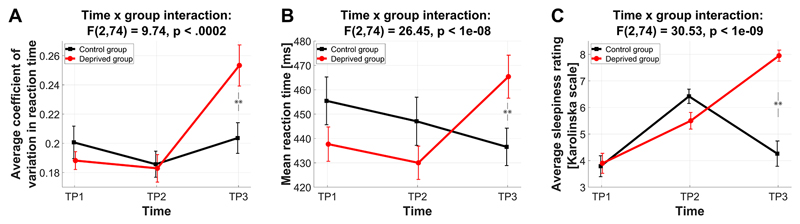
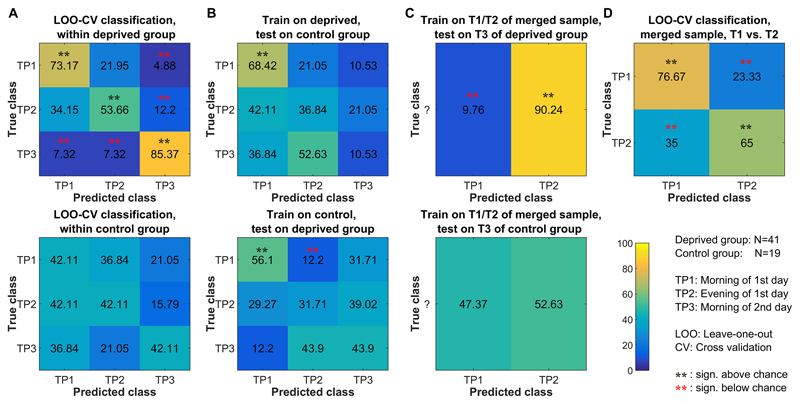
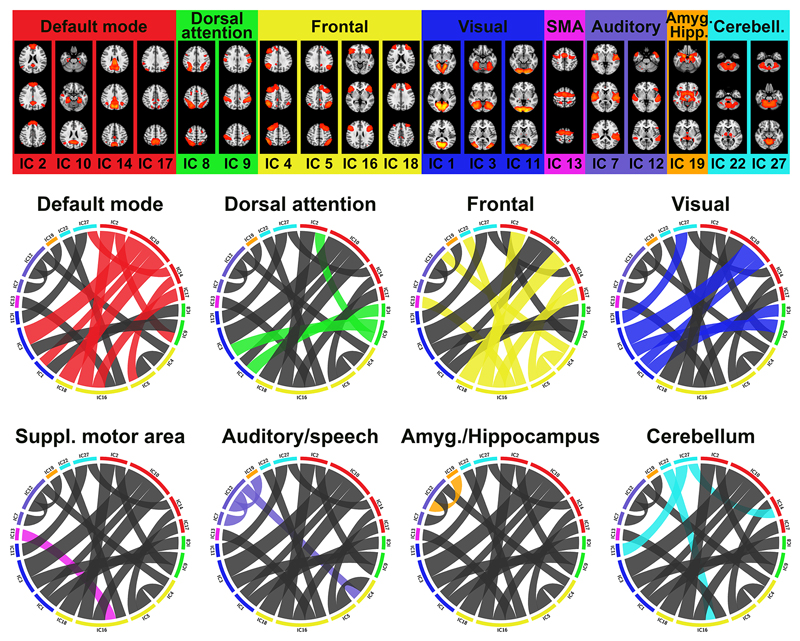
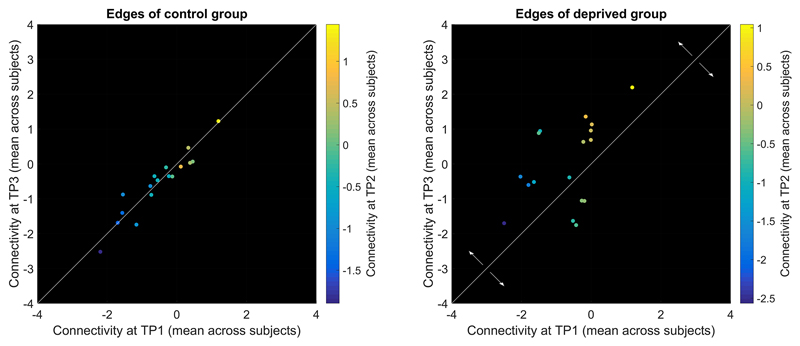
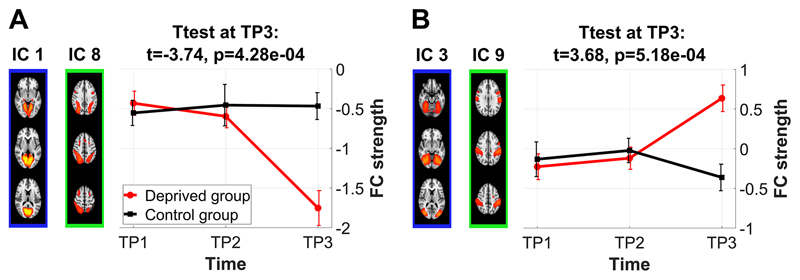
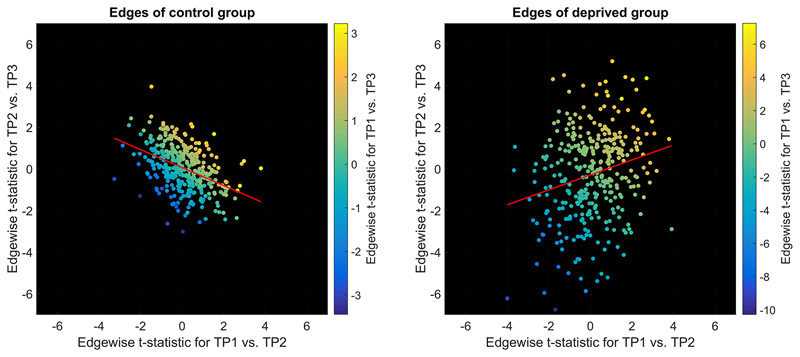
Sleep is a universal phenomenon necessary for maintaining homeostasis and function across a range of organs. Lack of sleep has severe health-related consequences affecting whole-body functioning, yet no other organ is as severely affected as the brain. The neurophysiological mechanisms underlying these deficits are poorly understood. Here, we characterize the dynamic changes in brain connectivity profiles inflicted by sleep deprivation and how they deviate from regular daily variability. To this end, we obtained functional magnetic resonance imaging data from 60 young, adult male participants, scanned in the morning and evening of the same day and again the following morning. 41 participants underwent total sleep deprivation before the third scan, whereas the remainder had another night of regular sleep. Sleep deprivation strongly altered the connectivity of several resting-state networks, including dorsal attention, default mode, and hippocampal networks. Multivariate classification based on connectivity profiles predicted deprivation state with high accuracy, corroborating the robustness of the findings on an individual level. Finally, correlation analysis suggested that morning-to-evening connectivity changes were reverted by sleep (control group)-a pattern which did not occur after deprivation. We conclude that both, a day of waking and a night of sleep deprivation dynamically alter the brain functional connectome.
Keywords: Circadian variability; Machine learning; Sleep deprivation; fMRI-based connectivity.
Copyright © 2015 Elsevier Inc. All rights reserved.
Conflict of interest statement
The authors declare no conflict of interest.
Figures
Similar articles
-
Spontaneous eyelid closures link vigilance fluctuation with fMRI dynamic connectivity states.Proc Natl Acad Sci U S A. 2016 Aug 23;113(34):9653-8. doi: 10.1073/pnas.1523980113. Epub 2016 Aug 10. Proc Natl Acad Sci U S A. 2016. PMID: 27512040 Free PMC article.
-
Intrinsic brain connectivity after partial sleep deprivation in young and older adults: results from the Stockholm Sleepy Brain study.Sci Rep. 2017 Aug 25;7(1):9422. doi: 10.1038/s41598-017-09744-7. Sci Rep. 2017. PMID: 28842597 Free PMC article.
-
Impact of 36 h of total sleep deprivation on resting-state dynamic functional connectivity.Brain Res. 2018 Jun 1;1688:22-32. doi: 10.1016/j.brainres.2017.11.011. Epub 2017 Nov 22. Brain Res. 2018. PMID: 29174693
-
Functional connectivity and the sleep-deprived brain.Prog Brain Res. 2019;246:159-176. doi: 10.1016/bs.pbr.2019.02.009. Epub 2019 Mar 21. Prog Brain Res. 2019. PMID: 31072560 Review.
-
Interpreting temporal fluctuations in resting-state functional connectivity MRI.Neuroimage. 2017 Dec;163:437-455. doi: 10.1016/j.neuroimage.2017.09.012. Epub 2017 Sep 12. Neuroimage. 2017. PMID: 28916180 Review.
Cited by
-
Behavioral and Electrophysiological Markers of Attention Fluctuations in Children with Hypersomnolence.J Clin Med. 2024 Aug 27;13(17):5077. doi: 10.3390/jcm13175077. J Clin Med. 2024. PMID: 39274290 Free PMC article.
-
Making group inferences using sparse representation of resting-state functional mRI data with application to sleep deprivation.Hum Brain Mapp. 2017 Sep;38(9):4671-4689. doi: 10.1002/hbm.23693. Epub 2017 Jun 19. Hum Brain Mapp. 2017. PMID: 28627049 Free PMC article.
-
Decreased resting-state alpha-band activation and functional connectivity after sleep deprivation.Sci Rep. 2021 Jan 12;11(1):484. doi: 10.1038/s41598-020-79816-8. Sci Rep. 2021. PMID: 33436726 Free PMC article.
-
Unstable wakefulness during resting-state fMRI and its associations with network connectivity and affective psychopathology in young adults.J Affect Disord. 2019 Nov 1;258:125-132. doi: 10.1016/j.jad.2019.07.066. Epub 2019 Jul 30. J Affect Disord. 2019. PMID: 31401540 Free PMC article.
-
Objective and subjective measures of prior sleep-wake behavior predict functional connectivity in the default mode network during NREM sleep.Brain Behav. 2019 Jan;9(1):e01172. doi: 10.1002/brb3.1172. Epub 2018 Dec 4. Brain Behav. 2019. PMID: 30516035 Free PMC article.
References
-
- Akerstedt T, Gillberg M. Subjective and objective sleepiness in the active individual. Int J Neurosci. 1990;52:29–37. - PubMed
-
- Almklov EL, Drummond SP, Orff H, Alhassoon OM. The Effects of Sleep Deprivation on Brain Functioning in Older Adults. Behav Sleep Med. 2014:1–22. - PubMed
-
- Alnaes D, Kaufmann T, Richard G, Duff EP, Sneve MH, Endestad T, Nordvik JE, Andreassen OA, Smith SM, Westlye LT. Attentional load modulates large-scale functional brain connectivity beyond the core attention networks. Neuroimage. 2015;109:260–272. - PubMed
-
- Anderson C, Platten CR. Sleep deprivation lowers inhibition and enhances impulsivity to negative stimuli. Behav Brain Res. 2011;217:463–466. - PubMed
Publication types
MeSH terms
Grants and funding
LinkOut - more resources
Full Text Sources
Other Literature Sources
