Combined motor cortex and spinal cord neuromodulation promotes corticospinal system functional and structural plasticity and motor function after injury
- PMID: 26708732
- PMCID: PMC4807330
- DOI: 10.1016/j.expneurol.2015.12.008
Combined motor cortex and spinal cord neuromodulation promotes corticospinal system functional and structural plasticity and motor function after injury
Abstract
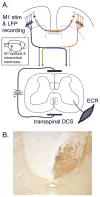
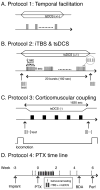
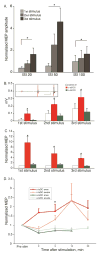
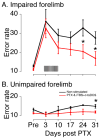
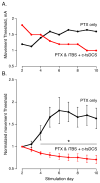
An important strategy for promoting voluntary movements after motor system injury is to harness activity-dependent corticospinal tract (CST) plasticity. We combine forelimb motor cortex (M1) activation with co-activation of its cervical spinal targets in rats to promote CST sprouting and skilled limb movement after pyramidal tract lesion (PTX). We used a two-step experimental design in which we first established the optimal combined stimulation protocol in intact rats and then used the optimal protocol in injured animals to promote CST repair and motor recovery. M1 was activated epidurally using an electrical analog of intermittent theta burst stimulation (iTBS). The cervical spinal cord was co-activated by trans-spinal direct current stimulation (tsDCS) that was targeted to the cervical enlargement, simulated from finite element method. In intact rats, forelimb motor evoked potentials (MEPs) were strongly facilitated during iTBS and for 10 min after cessation of stimulation. Cathodal, not anodal, tsDCS alone facilitated MEPs and also produced a facilitatory aftereffect that peaked at 10 min. Combined iTBS and cathodal tsDCS (c-tsDCS) produced further MEP enhancement during stimulation, but without further aftereffect enhancement. Correlations between forelimb M1 local field potentials and forelimb electromyogram (EMG) during locomotion increased after electrical iTBS alone and further increased with combined stimulation (iTBS+c-tsDCS). This optimized combined stimulation was then used to promote function after PTX because it enhanced functional connections between M1 and spinal circuits and greater M1 engagement in muscle contraction than either stimulation alone. Daily application of combined M1 iTBS on the intact side and c-tsDCS after PTX (10 days, 27 min/day) significantly restored skilled movements during horizontal ladder walking. Stimulation produced a 5.4-fold increase in spared ipsilateral CST terminations. Combined neuromodulation achieves optimal motor recovery and substantial CST outgrowth with only 27 min of daily stimulation compared with 6h, as in our prior study, making it a potential therapy for humans with spinal cord injury.
Keywords: Activity-dependent plasticity; Axon sprouting; Brain stimulation; Corticospinal tract; Motor cortex; Pyramidal tract lesion; Theta burst stimulation.
Copyright © 2015 Elsevier Inc. All rights reserved.
Figures



Similar articles
-
Motor cortex and spinal cord neuromodulation promote corticospinal tract axonal outgrowth and motor recovery after cervical contusion spinal cord injury.Exp Neurol. 2017 Nov;297:179-189. doi: 10.1016/j.expneurol.2017.08.004. Epub 2017 Aug 10. Exp Neurol. 2017. PMID: 28803750 Free PMC article.
-
Dual motor cortex and spinal cord neuromodulation improves rehabilitation efficacy and restores skilled locomotor function in a rat cervical contusion injury model.Exp Neurol. 2021 Jul;341:113715. doi: 10.1016/j.expneurol.2021.113715. Epub 2021 Apr 2. Exp Neurol. 2021. PMID: 33819448 Free PMC article.
-
Molecular signaling predicts corticospinal axon growth state and muscle response plasticity induced by neuromodulation.Proc Natl Acad Sci U S A. 2024 Nov 19;121(47):e2408508121. doi: 10.1073/pnas.2408508121. Epub 2024 Nov 13. Proc Natl Acad Sci U S A. 2024. PMID: 39536089
-
Neuroplasticity of spinal cord injury and repair.Handb Clin Neurol. 2022;184:317-330. doi: 10.1016/B978-0-12-819410-2.00017-5. Handb Clin Neurol. 2022. PMID: 35034745 Review.
-
Motor cortex electrical stimulation augments sprouting of the corticospinal tract and promotes recovery of motor function.Front Integr Neurosci. 2014 Jun 18;8:51. doi: 10.3389/fnint.2014.00051. eCollection 2014. Front Integr Neurosci. 2014. PMID: 24994971 Free PMC article. Review.
Cited by
-
Motor cortex and spinal cord neuromodulation promote corticospinal tract axonal outgrowth and motor recovery after cervical contusion spinal cord injury.Exp Neurol. 2017 Nov;297:179-189. doi: 10.1016/j.expneurol.2017.08.004. Epub 2017 Aug 10. Exp Neurol. 2017. PMID: 28803750 Free PMC article.
-
When Spinal Neuromodulation Meets Sensorimotor Rehabilitation: Lessons Learned From Animal Models to Regain Manual Dexterity After a Spinal Cord Injury.Front Rehabil Sci. 2021 Dec 7;2:755963. doi: 10.3389/fresc.2021.755963. eCollection 2021. Front Rehabil Sci. 2021. PMID: 36188826 Free PMC article. Review.
-
Spinal cord representation of motor cortex plasticity reflects corticospinal tract LTP.Proc Natl Acad Sci U S A. 2021 Dec 28;118(52):e2113192118. doi: 10.1073/pnas.2113192118. Proc Natl Acad Sci U S A. 2021. PMID: 34934000 Free PMC article.
-
Intermittent theta burst stimulation modulates biceps brachii corticomotor excitability in individuals with tetraplegia.J Neuroeng Rehabil. 2022 Jul 17;19(1):73. doi: 10.1186/s12984-022-01049-9. J Neuroeng Rehabil. 2022. PMID: 35843943 Free PMC article. Clinical Trial.
-
Transcranial Magnetic Stimulation with Intermittent Theta Burst Stimulation Alters Corticospinal Output in Patients with Chronic Incomplete Spinal Cord Injury.Front Neurol. 2017 Aug 4;8:380. doi: 10.3389/fneur.2017.00380. eCollection 2017. Front Neurol. 2017. PMID: 28824536 Free PMC article.
References
-
- Adkins DL, Campos P, Quach D, Borromeo M, Schallert K, Jones TA. Epidural cortical stimulation enhances motor function after sensorimotor cortical infarcts in rats. Exp Neurol. 2006;200:356–370. - PubMed
-
- Ahmed Z. Trans-spinal direct current stimulation modulates motor cortex-induced muscle contraction in mice. J Appl Physiol. 2011;110:1414–1424. - PubMed
-
- Ahmed Z, Wieraszko A. Trans-spinal direct current enhances corticospinal output and stimulation-evoked release of glutamate analog, D-2,33H-aspartic acid. J Appl Physiol 2012 - PubMed
Publication types
MeSH terms
Substances
Grants and funding
LinkOut - more resources
Full Text Sources
Other Literature Sources
Medical

