

Fast and efficient QTL mapper for thousands of molecular phenotypes
- PMID: 26708335
- PMCID: PMC4866519
- DOI: 10.1093/bioinformatics/btv722
Fast and efficient QTL mapper for thousands of molecular phenotypes
Abstract
Motivation: In order to discover quantitative trait loci, multi-dimensional genomic datasets combining DNA-seq and ChiP-/RNA-seq require methods that rapidly correlate tens of thousands of molecular phenotypes with millions of genetic variants while appropriately controlling for multiple testing.
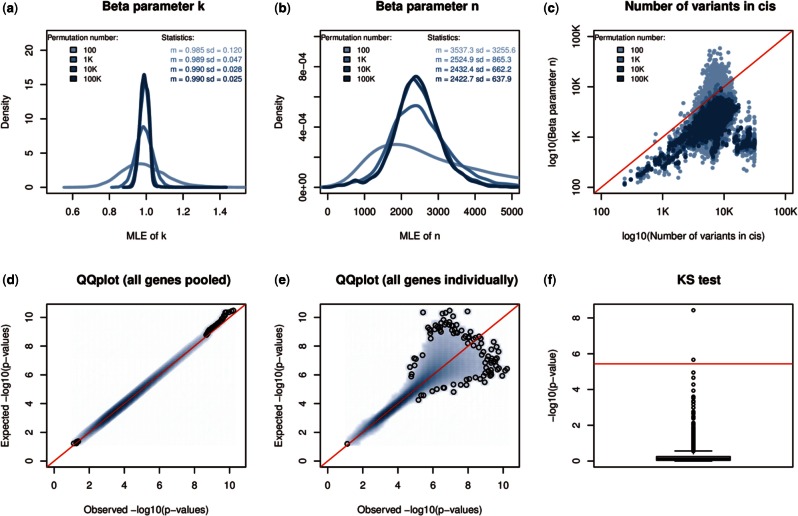
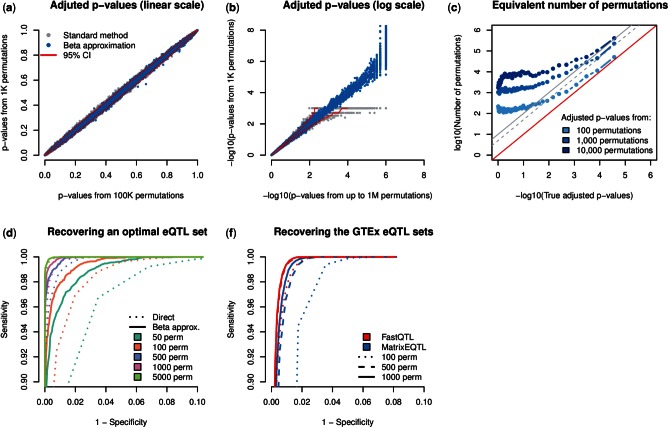
Results: We have developed FastQTL, a method that implements a popular cis-QTL mapping strategy in a user- and cluster-friendly tool. FastQTL also proposes an efficient permutation procedure to control for multiple testing. The outcome of permutations is modeled using beta distributions trained from a few permutations and from which adjusted P-values can be estimated at any level of significance with little computational cost. The Geuvadis & GTEx pilot datasets can be now easily analyzed an order of magnitude faster than previous approaches.
Availability and implementation: Source code, binaries and comprehensive documentation of FastQTL are freely available to download at http://fastqtl.sourceforge.net/
Contact: emmanouil.dermitzakis@unige.ch or olivier.delaneau@unige.ch
Supplementary information: Supplementary data are available at Bioinformatics online.
© The Author 2015. Published by Oxford University Press.
Figures
Similar articles
-
MBV: a method to solve sample mislabeling and detect technical bias in large combined genotype and sequencing assay datasets.Bioinformatics. 2017 Jun 15;33(12):1895-1897. doi: 10.1093/bioinformatics/btx074. Bioinformatics. 2017. PMID: 28186259 Free PMC article.
-
veqtl-mapper: variance association mapping for molecular phenotypes.Bioinformatics. 2017 Sep 1;33(17):2772-2773. doi: 10.1093/bioinformatics/btx273. Bioinformatics. 2017. PMID: 28449110 Free PMC article.
-
PRESTO: rapid calculation of order statistic distributions and multiple-testing adjusted P-values via permutation for one and two-stage genetic association studies.BMC Bioinformatics. 2008 Jul 13;9:309. doi: 10.1186/1471-2105-9-309. BMC Bioinformatics. 2008. PMID: 18620604 Free PMC article.
-
Trinculo: Bayesian and frequentist multinomial logistic regression for genome-wide association studies of multi-category phenotypes.Bioinformatics. 2016 Jun 15;32(12):1898-900. doi: 10.1093/bioinformatics/btw075. Epub 2016 Feb 11. Bioinformatics. 2016. PMID: 26873930 Free PMC article.
-
Quantitative trait locus analysis using J/qtl.Methods Mol Biol. 2009;573:175-88. doi: 10.1007/978-1-60761-247-6_10. Methods Mol Biol. 2009. PMID: 19763928 Review.
Cited by
-
The regulatory landscape of multiple brain regions in outbred heterogeneous stock rats.Nucleic Acids Res. 2022 Oct 28;50(19):10882-10895. doi: 10.1093/nar/gkac912. Nucleic Acids Res. 2022. PMID: 36263809 Free PMC article.
-
Population-scale proteome variation in human induced pluripotent stem cells.Elife. 2020 Aug 10;9:e57390. doi: 10.7554/eLife.57390. Elife. 2020. PMID: 32773033 Free PMC article.
-
Population-scale tissue transcriptomics maps long non-coding RNAs to complex disease.Cell. 2021 May 13;184(10):2633-2648.e19. doi: 10.1016/j.cell.2021.03.050. Epub 2021 Apr 16. Cell. 2021. PMID: 33864768 Free PMC article.
-
Genetic analyses support the contribution of mRNA N6-methyladenosine (m6A) modification to human disease heritability.Nat Genet. 2020 Sep;52(9):939-949. doi: 10.1038/s41588-020-0644-z. Epub 2020 Jun 29. Nat Genet. 2020. PMID: 32601472 Free PMC article.
-
Genetic Insights of Schizophrenia via Single Cell RNA-Sequencing Analyses.Schizophr Bull. 2023 Jul 4;49(4):914-922. doi: 10.1093/schbul/sbad002. Schizophr Bull. 2023. PMID: 36805283 Free PMC article.
References
-
- Aulchenko Y.S. et al. (2007) GenABEL: an R library for genome-wide association analysis. Bioinformatics, 23, 1294–1296. - PubMed
-
- Benjamini Y., Hochberg Y. (1995) Controlling the false discovery rate: a practical and powerful approach to multiple testing. J. R. Stat. Soc., 57, 289–300.
MeSH terms
LinkOut - more resources
Full Text Sources
Other Literature Sources
