. 2016 Jan;65(1):53-61.
doi: 10.2337/db15-0770.

The microRNA-29 Family Dictates the Balance Between Homeostatic and Pathological Glucose Handling in Diabetes and Obesity

Affiliations

The microRNA-29 Family Dictates the Balance Between Homeostatic and Pathological Glucose Handling in Diabetes and Obesity

James Dooley et al. Diabetes. 2016 Jan.

Abstract

The microRNA-29 (miR-29) family is among the most abundantly expressed microRNA in the pancreas and liver. Here, we investigated the function of miR-29 in glucose regulation using miR-29a/b-1 (miR-29a)-deficient mice and newly generated miR-29b-2/c (miR-29c)-deficient mice. We observed multiple independent functions of the miR-29 family, which can be segregated into a hierarchical physiologic regulation of glucose handling. miR-29a, and not miR-29c, was observed to be a positive regulator of insulin secretion in vivo, with dysregulation of the exocytotic machinery sensitizing β-cells to overt diabetes after unfolded protein stress. By contrast, in the liver both miR-29a and miR-29c were important negative regulators of insulin signaling via phosphatidylinositol 3-kinase regulation. Global or hepatic insufficiency of miR-29 potently inhibited obesity and prevented the onset of diet-induced insulin resistance. These results demonstrate strong regulatory functions for the miR-29 family in obesity and diabetes, culminating in a hierarchical and dose-dependent effect on premature lethality.


Figures

Figure 1
Figure 1
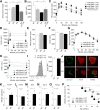
miR-29a prevents diabetes during unfolded protein stress by positive regulation of insulin secretion. AD: Unmanipulated wild-type, miR-29a+/−, and miR-29a−/− mice, as well as miR-29a−/− mice transplanted with wild-type islets, were fasted for 6 h. Fasting blood glucose levels (n = 19, 20, 19, and 5, respectively) (A) and fasting serum insulin levels (n = 16, 15, 9, and 6) (B). Blood glucose levels (n = 19, 20, 19, and 5) (C) and serum insulin levels (n = 16, 15, 9, and 6) (D) after glucose challenge. EH: Wild-type, miR-29c+/−, and miR-29c−/− mice were fasted for 6 h. Fasting blood glucose levels (n = 9, 13, and 7) (E) and serum insulin levels (n = 9, 13, and 7) (F). Blood glucose levels (n = 9, 13, and 7) (G) and serum insulin levels (n = 9, 13, and 7) (H) after glucose challenge. I: Representative histograms and mean fluorescence intensity (MFI) of anti-insulin antibody staining on islets purified from wild-type and miR-29a−/− mice (n = 5 and 4). J: Representative immunofluorescence staining on the pancreas of wild-type and miR-29a−/− mice for insulin (red) and glucagon (green) (n = 3 and 4). Scale bar indicates 50 μm. K: Whole pancreas was taken from wild-type and miR-29a−/− mice, and quantitative PCR was performed for insulin relative to Rpl37a. LO: Islets were purified from wild-type and miR-29a−/− mice, and quantitative PCR was performed for insulin (L), Mct1 (M), Stx1a (N), and Vamp3 (O) relative to Rpl37a (n = 7,4). P: Diabetes incidence of insHEL transgenic males on the miR-29awt/wt (n = 11), miR-29awt/0 (n = 9), and miR-29a0/0 (n = 7) backgrounds. No diabetes was observed in mice of any genotype without the insHEL transgene. Median ± SEM. *P < 0.05, **P < 0.01, ***P < 0.001. Het, heterozygote; KO, knockout; WT, wild-type.
Figure 2
Figure 2
The miR-29 family is a positive regulator of insulin sensitivity in hepatocytes. A: Unmanipulated wild-type, miR-29a+/−, and miR-29a−/− mice, as well as miR-29a−/− mice transplanted with wild-type islets, were fasted for 6 h and challenged with exogenous insulin prior to measurement of blood glucose levels (n = 24, 35, 19, and 6, respectively). B: Wild-type, miR-29c+/−, and miR-29c−/− mice were fasted for 6 h and challenged with exogenous insulin prior to measurement of blood glucose levels (n = 9, 13, and 7). C: Whole liver was taken from wild-type and Alb-Cre miR-29cfl/fl mice (n = 6 and 6). Quantitative PCR was performed for miR-29c relative to Sno202. D: Wild-type, miR-29c−/−, and Alb-Cre miR-29cfl/fl mice were fasted for 6 h and challenged with exogenous insulin prior to measurement of blood glucose levels (n = 15, 5, and 8). * and # indicate significance of Alb-Cre miR-29cfl/fl mice vs. wild-type and miR-29c−/− mice, respectively. E: Wild-type, miR-29a−/−, and miR-29c−/− mice were challenged with hyperinsulinemic clamps and maintained at hypoglycemic blood glucose levels (left). The glucose infusion rate required to maintain stable hypoglycemia was calculated (right) (n = 7, 3, and 4). F: Glucagon levels from wild-type, miR-29a−/−, and miR-29c−/− mice during hypoglycemic-hyperinsulinemic clamps (n = 7, 3, and 4). Median ± SEM. *P < 0.05, **P < 0.01, #P < 0.05, and ##P < 0.01. KO, knockout; WT, wild-type.
Figure 3
Figure 3
The miR-29 family regulates hepatic PI3K expression. cDNA was produced from the liver of wild-type, miR-29a−/−, and miR-29c−/− mice, and quantitative PCR was performed for PGC-1a (A) and G6Pase (B), relative to Rpl37a (n = 9, 7, and 3, respectively). C: Blood glucose levels of wild-type, miR-29a+/−, and miR-29a−/− mice after fasting and challenge with exogenous glucagon. D: Mean fluorescence intensity (MFI) of anti-glucagon antibody staining on islets purified from wild-type and miR-29a−/− mice (n = 5 and 4). E: cDNA was produced from the liver of wild-type, miR-29a−/−, and miR-29c−/− mice, and quantitative PCR was performed for PI3K, relative to Rpl37a (n = 9, 7, and 3). F: Protein lysate was produced from the liver of wild-type, miR-29a−/−, and miR-29c−/− mice after fasting at 30 min after insulin injection, and Western blotting was performed for PI3K. G: Wild-type, miR-29a+/−, and miR-29a−/− mice were fasted for 6 h, injected with wortmannin, and challenged with exogenous insulin, prior to measurement of blood glucose levels (n = 4, 12, and 6). H: Wild-type and miR-29a−/− mice were fasted for 6 h and challenged with exogenous insulin prior to measurement of blood glucose levels (n = 28 and 24). At 60 min postinsulin treatment, wortmannin was given to a subset of individuals from each genotype (n = 4 and 6). Median ± SEM. **P < 0.01 and ***P < 0.001. KO, knockout; n.s., not significant; WT, wild-type.
Figure 4
Figure 4
Loss of miR-29 family members protects against obesity and insulin resistance. Weights (A) and head-tail lengths (B) of wild-type, miR-29a+/−, and miR-29a−/− mice at 10 weeks of age, separated by sex (weights, n = 13, 8, and 11, respectively, for female and n = 14, 17, and 9 for male; length, n = 5, 7, and 6 for female and n = 6, 8, and 6 for male). Percentage body composition of lean mass (C) and adipose tissue mass (D) for unmanipulated wild-type, miR-29a+/−, and miR-29a−/− mice and miR-29a−/− mice transplanted with wild-type islets, all at 14 weeks of age (n = 20, 3, 12, and 5). E: Serum leptin concentrations in wild-type, miR-29a+/−, and miR-29a−/− mice at 10 weeks of age (n = 12, 18, and 9). F: Food consumption for wild-type, miR-29a−/−, and miR-29c−/− mice at 10 weeks of age (n = 8, 4, and 8). G: Serum total ghrelin concentrations in wild-type, miR-29a+/−, and miR-29a−/− mice at 10 weeks of age (n = 6, 5, and 7). H: Weight gain for wild-type, miR-29a−/−, miR-29c−/−, and Alb-Cre miR-29cfl/fl mice placed on a high-fat diet (n = 32, 8, 13, and 6). I: Wild-type and miR-29c−/− mice on a high-fat diet were fasted for 6 h and challenged with exogenous insulin prior to measurement of blood glucose levels (n = 22 and 13). J: Survival curve for wild-type, miR-29a+/−, miR-29a−/−, miR-29c+/−, miR-29c−/−, miR-29a+/−miR-29c+/−, miR-29a−/−miR-29c+/−, miR-29c+/−miR-29c−/−, and miR-29a−/−miR-29c−/− mice (n = 29, 29, 29, 54, 24, 52, 17, 17, and 4). Median ± SEM. *P < 0.05, **P < 0.01, ***P < 0.001.

Similar articles

Cited by

References

    1. Rottiers V, Näär AM. MicroRNAs in metabolism and metabolic disorders. Nat Rev Mol Cell Biol 2012;13:239–250 - PMC - PubMed
    1. Choong CS, Priest JR, Foulkes WD. Exploring the endocrine manifestations of DICER1 mutations. Trends Mol Med 2012;18:503–505 - PubMed
    1. Mandelbaum AD, Melkman-Zehavi T, Oren R, et al. . Dysregulation of Dicer1 in beta cells impairs islet architecture and glucose metabolism. Exp Diabetes Res 2012;2012:470302. - PMC - PubMed
    1. Kalis M, Bolmeson C, Esguerra JL, et al. . Beta-cell specific deletion of Dicer1 leads to defective insulin secretion and diabetes mellitus. PLoS One 2011;6:e29166. - PMC - PubMed
    1. Melkman-Zehavi T, Oren R, Kredo-Russo S, et al. . miRNAs control insulin content in pancreatic β-cells via downregulation of transcriptional repressors. EMBO J 2011;30:835–845 - PMC - PubMed

Publication types