. 2016 Feb 4;18(2):262-75.
doi: 10.1016/j.stem.2015.11.007. Epub 2015 Dec 10.

3D Chromosome Regulatory Landscape of Human Pluripotent Cells

Affiliations

3D Chromosome Regulatory Landscape of Human Pluripotent Cells

Xiong Ji et al. Cell Stem Cell. .

Abstract

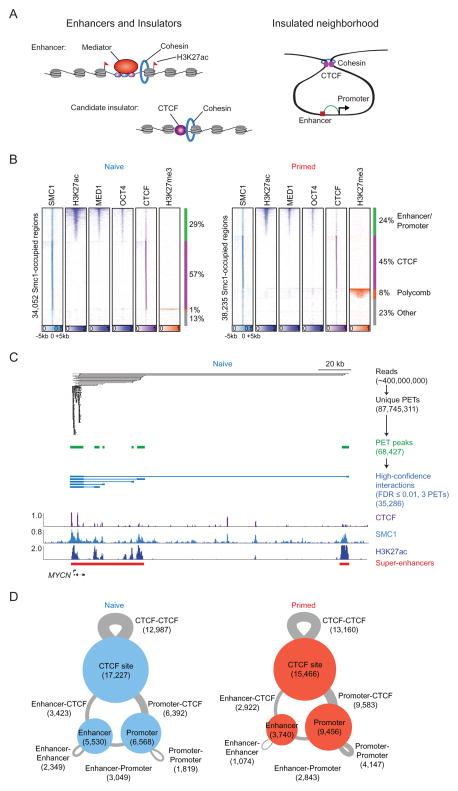
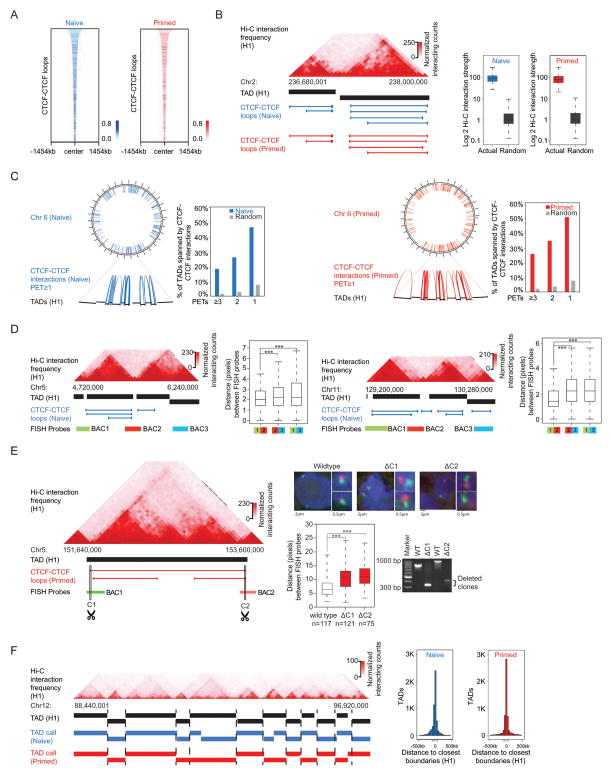
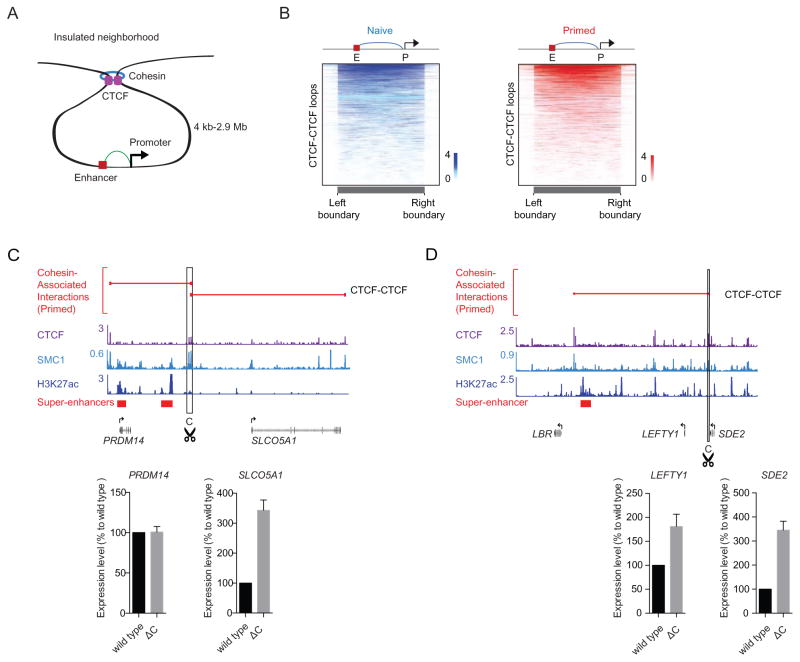
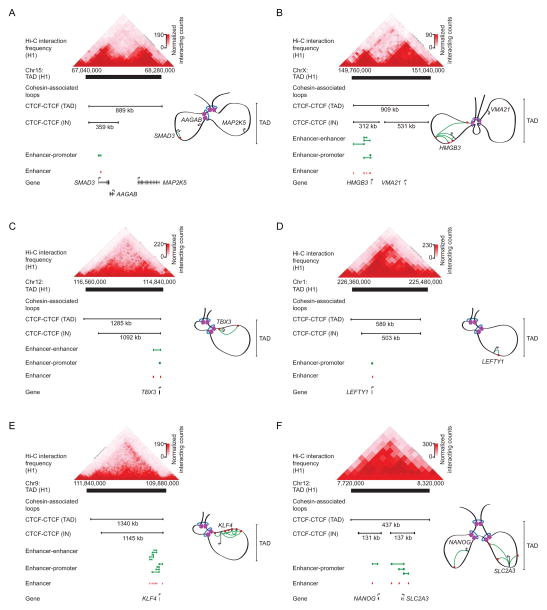
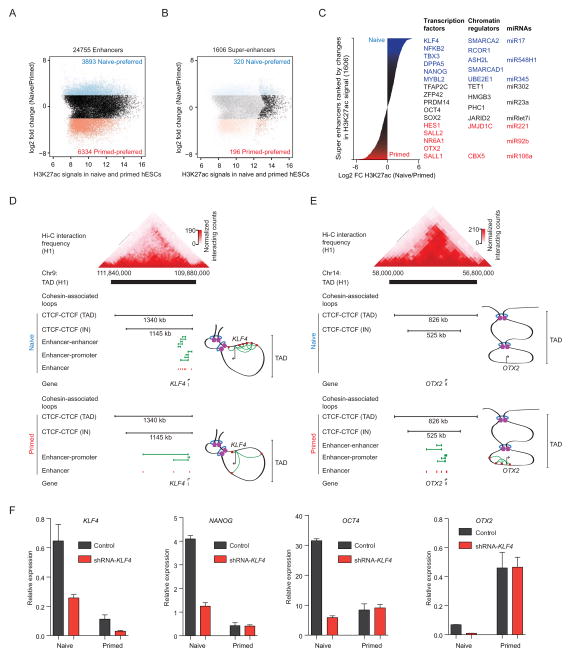
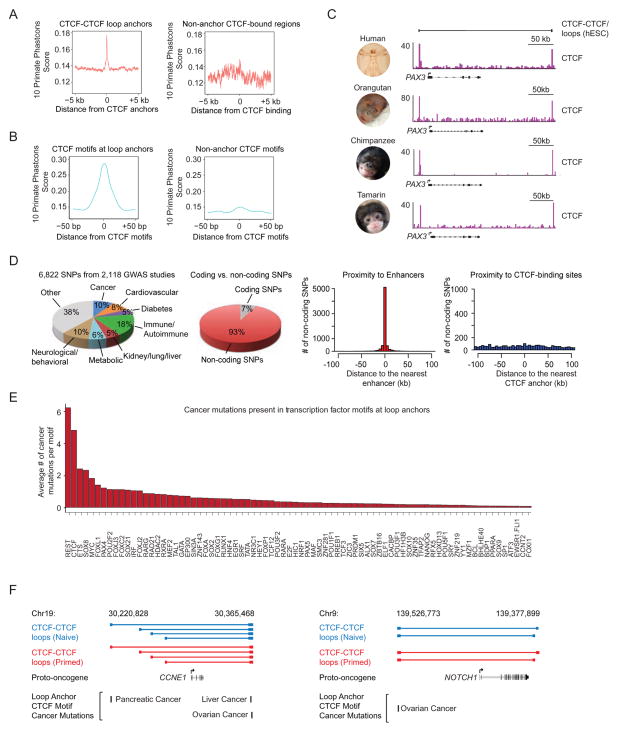
In this study, we describe the 3D chromosome regulatory landscape of human naive and primed embryonic stem cells. To devise this map, we identified transcriptional enhancers and insulators in these cells and placed them within the context of cohesin-associated CTCF-CTCF loops using cohesin ChIA-PET data. The CTCF-CTCF loops we identified form a chromosomal framework of insulated neighborhoods, which in turn form topologically associating domains (TADs) that are largely preserved during the transition between the naive and primed states. Regulatory changes in enhancer-promoter interactions occur within insulated neighborhoods during cell state transition. The CTCF anchor regions we identified are conserved across species, influence gene expression, and are a frequent site of mutations in cancer cells, underscoring their functional importance in cellular regulation. These 3D regulatory maps of human pluripotent cells therefore provide a foundation for future interrogation of the relationships between chromosome structure and gene control in development and disease.


Figures

Figure 1
Figure 1. Components of 3D regulatory landscape
(A) Enhancers and insulators (left panel). Enhancers are occupied by transcription factors, mediator and cohesin, and their associated nucleosomes are marked by H3K27ac. Candidate insulators are occupied by CTCF and cohesin. Model of insulated neighborhoods formed by cohesin-associated CTCF-CTCF interactions, within which enhancers loop to promoters of target genes (right panel). (B) Heatmap representation of ChIP-seq data for H3K27ac, MED1, OCT4, CTCF and H3K27me3 at SMC1-occupied regions in naive (left panel) and primed (right panel) hESCs. Read density is displayed within a 10 kb window and color scale intensities are shown in rpm/bp. Cohesin occupies three classes of sites: enhancer-promoter sites, Polycomb-occupied sites, and CTCF-occupied sites. (C) Cohesin (SMC1) ChIA-PET data analysis at the MYCN locus in naive hESCs. The algorithm used to identify paired-end tags (PETs) is described in Extended Experimental Procedures. PETs and interactions involving enhancers and promoters within the window are displayed at each step in the analysis pipeline. Binding profiles for CTCF, SMC1 and H3K27ac are displayed at the bottom. (D) High-confidence cohesin-associated interaction maps in naive (left panel) and primed (right panel) hESCs. CTCF binding sites, enhancers and promoters involved in cohesin-associated interactions are indicated as circles, and the size of circles correspond to the number of sites. The interactions between two regions are indicated as gray lines, and the size of lines correspond to the number of interactions. See also Figure S1, Table S1, S2, S3
Figure 2
Figure 2. CTCF-CTCF loops underlie much of TAD structure
(A) Heatmap of cohesin-associated CTCF-CTCF loops showing that these loops in naive hESCs are largely preserved in primed hESCs. The 9,344 CTCF-CTCF loops that define the putative insulated neighborhoods in naive hESCs were ranked by size and shown. The color bar indicates normalized PET-signal at these CTCF-CTCF loops. (B) TAD heat map of interaction frequencies and CTCF-CTCF loops that define the putative insulated neighborhoods. Normalized Hi-C interaction frequencies in H1 hESCs are displayed in a two-dimensional heat map (Dixon et al., 2015) with the TADs indicated as black bars. Shared CTCF-CTCF loops are indicated as blue lines (naive) and red lines (primed). A correlation analysis between Hi-C interaction frequency (H1 hESCs) and CTCF-CTCF loops in naive and primed hESCs is displayed to the right in a box plot; randomly generated TADs were used as the background control. (C) CTCF-CTCF loops span many TADs identified using Hi-C data in H1 hESCs. Chromosome 6 is displayed as a circos plot in both naive and primed hESCs, with zoomed in regions below. CTCF-CTCF loops (≥1 PETs) are indicated as blue arcs (naive) and red arcs (primed). The bar graphs show percentages of TADs spanned by CTCF-CTCF loops when various confidence thresholds (1, 2, ≥3 PETs) were used. Random shuffling of TAD locations (100 iterations) serve as the background control. (D) Physical distance between TAD borders is shorter than an equidistant control locus. The Hi-C interaction heatmaps, TADs and CTCF-CTCF loops were shown the same as (B). The green, red and blue bars indicate the location of BAC probes used for DNA FISH at each locus. Box plots of minimal normalized distances between pairs of loci generated from >1500 FISH probe spots per condition are displayed with the corresponding probe pairs labeled below. The stars indicate significance using the Mann-Whitney test (***P<10−28). Images were obtained using a 40X objective. (E) Measurement of DNA proximity by 3D DNA FISH before and after deletions of CTCF binding sites at either end of a TAD-spanning CTCF-CTCF loop. The Hi-C interaction heatmaps, TADs and CTCF-CTCF loops were shown the same as (B). The green and red bars indicate the location of BAC probes used for DNA FISH. The scissor-marked regions (C1, C2) were deleted by CRISPR-mediated deletion. Examples of two color DNA FISH images are shown in the right panel, the quantification of distance between green and red probes are displayed with bar graphs shown below. The stars indicate significance using the Mann-Whitney test (***P<10−13). Images were obtained using a 100X objective; the n indicates the number of alleles quantified for each sample. The genotyping PCR data are displayed at the bottom right. (F) Cohesin ChIA-PET data can be used to discover TADs. A comparison of TADs derived with the same algorithm from Hi-C data (Dixon et al., 2015) and cohesin ChIA-PET data for a portion of chromosome 12 (left panel). A global analysis indicates that the cohesin ChIA-PET and Hi-C derived TAD boundaries are close (right panel). See also Figure S2, Table S3
Figure 3
Figure 3. Putative insulated neighborhoods in hESCs
(A) Schematic of insulated neighborhood. (B) Enhancer-promoter interactions occur predominantly within CTCF-CTCF loops that define putative insulated neighborhoods in hESCs. The color bar indicates the number of enhancer-promoter interactions spanning the genomic location. (C) and (D) CRISPR-mediated deletion of CTCF sites at two loci (PRDM14 locus (C) and LEFTY1 locus (D)). The top of each panel shows a subset of CTCF-CTCF loops depicted as red lines and binding profiles for CTCF, cohesin (SMC1), and H3K27ac in primed hESCs at the respective loci. A subset of genes present in these loops is shown for simplicity. The super-enhancers are indicated as red bars. The bottom of each panel shows RT-qPCR results for the gene expression levels of the indicated genes in wild type and cells with deleted CTCF sites. Error bars were generated from at least three replicates. See also Figure S3
Figure 4
Figure 4. 3D regulatory structures of TADs containing key pluripotency genes
(A–F) Schematics of 3D structure for TADs containing SMAD3, HMGB3, TBX3, LEFTY1, KLF4 and NANOG in naive hESCs. For each TAD, Hi-C interaction data (Dixon et al., 2015) is shown together with cohesin-associated loop data for TAD-spanning CTCF loops, insulated neighborhood-spanning CTCF loops, enhancer-enhancer loops and enhancer-promoter loops. A subset of CTCF-CTCF loops was selected for display based on a directionality index (Extended Experimental Procedures) and a subset of genes present in these loops is shown for simplicity. See also Figure S4
Figure 5
Figure 5. Differential enhancer landscape reveals key transcription factors, chromatin regulators and miRNAs in naive and primed pluripotency
(A) Scatterplot comparison of H3K27ac ChIP-seq peaks used to call enhancers in naive and primed hESCs. (B) Scatterplot comparison of super-enhancers in naive and primed hESCs. (C) Distribution of differential H3K27ac ChIP-seq signal density across the super-enhancer regions of naive and primed hESCs. Genes encoding key transcription factors, chromatin regulators, and miRNAs associated with super-enhancers are listed. (D) 3D regulatory structure of a TAD containing KLF4 in both naive and primed hESCs with Hi-C and cohesin ChIA-PET data as described in Figure 4. The naive and primed cells share TAD and insulated neighborhood structure, but a super-enhancer and cohesin-associated interactions between the super-enhancer and the KLF4 promoter are readily detected only in naive cells. (E) 3D regulatory structure of a TAD containing OTX2 in both naive and primed hESCs with Hi-C, cohesin ChIA-PET and enhancer data as described in (D). (F) Gene expression analysis after shRNA knockdown of KLF4 in naive and primed hESCs. The RT-qPCR results were displayed as black (control) and red (shRNA KLF4) bar graphs. Error bars were generated from at least three replicates. See also Figure S5, Table S4
Figure 6
Figure 6. Conservation of 3D structure and associations with disease
(A) and (B) DNA sequence in anchor regions (A) and the CTCF DNA sequence motif (B) of CTCF-CTCF loops in hESCs is more conserved in primates than DNA sequence in hESC regions bound by CTCF that do not serve as loop anchors. (C) A CTCF-CTCF loop containing the PAX3 gene in human and ChIP-seq gene tracks showing conserved binding of CTCF at this locus in Human, Orangutan, Chimpanzee and Tamarin genomes (Schwalie et al., 2013). (D) Catalog of SNPs linked to phenotypic traits and diseases in genome-wide association studies (GWAS) and SNP association with enhancer and CTCF anchor regions in hESCs. Pie chart showing percentage of SNPs associated with the highlighted classes of traits and diseases (Left). Distribution of trait-associated SNPs in coding and noncoding regions of the genome (Middle Left). Location of all noncoding trait-associated SNPs relative to all enhancers identified in 86 human cell and tissue samples. x axis reflects binned distances of each SNP to the nearest enhancer. SNPs located within enhancers are assigned to the 0 bin (Middle Right). Location of all noncoding trait-associated SNPs relative to CTCF binding sites in loop anchor regions (Right). (E) Cancer mutations in transcription factor motifs at hESC CTCF-CTCF loop anchors. (F) Cancer mutations found at CTCF motifs at the anchors of CTCF-CTCF loops in hESCs that contain the proto-oncogenes CCNE1 and NOTCH1. Blue (naive) and red (primed) CTCF-CTCF loops with mutations within the CTCF motifs in their anchors are displayed above the proto-oncogene contained within these loops. Below, mutations from the International Cancer Genome Consortium are displayed along with the cancers from which these were sequenced. See also Figure S6, Table S5

Comment in

Similar articles

Cited by

References

    1. Banerji J, Rusconi S, Schaffner W. Expression of a beta-globin gene is enhanced by remote SV40 DNA-sequences. Cell. 1981;27:299–308. - PubMed
    1. Bell AC, West AG, Felsenfeld G. The protein CTCF is required for the enhancer blocking activity of vertebrate insulators. Cell. 1999;98:387–396. - PubMed
    1. Benoist C, Chambon P. In vivo sequence requirements of the SV40 early promoter region. Nature. 1981;290:304–310. - PubMed
    1. Bickmore WA. The Spatial Organization of the Human Genome. Annual Review of Genomics and Human Genetics. 2013;14:67–84. - PubMed
    1. Calhoun ES, Jones JB, Ashfaq R, Adsay V, Baker SJ, Valentine V, Hempen PM, Hilgers W, Yeo CJ, Hruban RH, et al. BRAF and FBXW7 (CDC4, FBW7, AGO, SEL10) mutations in distinct subsets of pancreatic cancer: potential therapeutic targets. The American journal of pathology. 2003;163:1255–1260. - PMC - PubMed

Publication types

MeSH terms