. 2016 Mar;30(3):335-47.
doi: 10.1210/me.2015-1058. Epub 2015 Dec 18.

Tissue-Specific Expression of Estrogen Receptor 1 Is Regulated by DNA Methylation in a T-DMR

Affiliations

Tissue-Specific Expression of Estrogen Receptor 1 Is Regulated by DNA Methylation in a T-DMR

Ryo Maekawa et al. Mol Endocrinol. 2016 Mar.

Abstract

The mechanism controlling tissue-specific expression of estrogen receptor 1 (ESR1) is unclear. In other genes, DNA methylation of a region called the tissue-dependent and differentially methylated region (T-DMR) has been associated with tissue-specific gene expression. This study investigated whether human ESR1 has a T-DMR and whether DNA methylation of the T-DMR regulates its expression. ESR1 expression was tissue-specific, being high in the endometrium and mammary gland and low/nil in the placenta and skin. Therefore, DNA methylation profiles of the promoter of ESR1 were analyzed in these tissues and in breast cancer tissues. In all of the normal tissues, the proximal promoter regions were unmethylated. On the other hand, the distal regions (T-DMR) were unmethylated in the endometrium and mammary gland, but were moderately methylated and hypermethylated in the placenta and skin, respectively. T-DMR-methylated reporter assay was performed to examine whether DNA methylation at the T-DMR suppresses ESR1 transcription. T-DMR, but not the promoter region, had transcriptional activities and DNA methylation of the T-DMR suppressed ESR1 transcription. Early growth response protein 1 was shown to be a possible transcription factor to bind the T-DMR and up-regulate ESR1 expression. ESR1 has several upstream exons, and each upstream exon, Exon-A/Exon-B/Exon-C, had its own T-DMR. In some breast cancer cases and breast cancer cell lines, ESR1 expression was not regulated by DNA methylation at T-DMR as it is in normal tissues. In conclusion, ESR1 has a T-DMR. DNA methylation status at the T-DMR is involved in tissue-specific ESR1 expression in normal tissues but not always in breast cancer.


Figures

Figure 1.
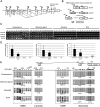
Figure 1.. ESR1 mRNA expression and DNA methylation statuses of the ESR1 promoter.
A, mRNA expression levels of ESR1 in endometrium, mammary gland, placenta, and skin were determined by RT-PCR and quantified by densitometry. The data were normalized to GAPDH (an internal control). Three tissue samples were examined in each tissue type. B, The diagram shows a detailed map of approximately 1.5-kb region around the TSS (arrow) at the promoter region of ESR1. The position of the TSS is designated as +1. The vertical lines indicate positions of CpG sites. The thick horizontal lines indicate the distal region (T-DMR1, −1188 to −790 bp) and promoter region (−556 to +229 bp). DNA methylation status of these CpG sites is shown. Methylation status of all the CpG sites between −1188 and +229 bp (56CpG sites) was analyzed by sodium bisulfite genomic sequencing in endometrium, mammary gland, placenta, and skin. Open and filled circles indicate unmethylated and methylated CpG status, respectively. The percentage of the methylated CpG sites in a total of the examined CpG sites was shown. C, DNA methylation status of CpG sites in the distal region (T-DMR1, −1188 to −790 bp) was analyzed in additional 2 tissue samples of endometrium, mammary gland, placenta, and skin.
Figure 2.
Figure 2.. T-DMR-methylated reporter assay.
A, Reporter assay to compare the promoter activity between the promoter+T-DMR and the promoter of ESR1. Horizontal bars show the relative luciferase activities to pGL-3 basic vector. The values are mean ± SEM of 3 independent assays. *, P < .05. B, Production of T-DMR-methylated reporter constructs (see Supplemental Figure 1). A 5′-flanking promoter region (−651 to +37 bp) and the T-DMR1 (−1244 to −638 bp) of ESR1 were amplified and designated as ESR1-promoter and ESR1-Tdmr, respectively. Both ESR1-promoter and ESR1-Tdmr fragments were inserted together into pGL3 basic vector. After the amplification of this vector using E.coli strain SCS110 (Stratagene), the ESR1-Tdmr fragment was excised from the vector and mock treated or treated with SssI methylase (New England Biolabs). The resultant unmethylated and methylated ESR1-Tdmr fragments were religated with the linearized vector fragment to create 2 types of reporter constructs: pGL-TDMR-U (unmethylated) and pGL3-TDMR-M (methylated). C, DNA methylation status of T-DMR1 (−1188 to −790 bp) and proximal promoter region (−556 to +37 bp) of pGL-TDMR-M and pGL3-TDMR-U constructs were analyzed by sodium bisulfite genomic sequencing. Open and filled circles indicate unmethylated and methylated CpG status, respectively. D, T-DMR-methylated reporter assay to assess the effect of DNA methylation at T-DMR on the transcriptional activity of the ESR1 promoter. Horizontal bars show the relative luciferase activities to pGL-3 basic vector. The values are mean ± SEM of 3 independent assays. *, P < .05.
Figure 3.
Figure 3.. DNA methylation statuses around upstream exons and mRNA expression of ESR1 variants in normal tissues.
A, Genomic organization of upstream exons and corresponding TSSs of ESR1. The upstream exons are shown by boxes, and the corresponding TSSs are indicated by arrows. The numbers below the upstream exon boxes indicate 5′ start sites, splice donor site and acceptor sites, which are involved in generating mature ESR1 mRNA with the distance from the originally described TSS at +1. All 5′ upstream exons are spliced at the common acceptor splice site (+163 bp). B, The primer design to investigate the transcribed mRNAs of variant1, variant2, and variant3, separately. C and D, ESR1 mRNA expression of variant1, variant2, and variant3 was analyzed by RT-PCR and qRT-PCR using primers shown in Figure 3B and Supplemental Table 2. GAPDH was used as an internal control. The value of mRNA of each variant was normalized to that of the internal control (GADPH). Data were expressed as a ratio of mRNA of each variant to GADPH. Each bar represents the mean ± SEM of the number of tissue samples; endometrium (n = 10), mammary gland (n = 10), placenta (n = 12), and skin (n = 3). E, DNA methylation statuses of AB-promoter (−556 to +229 bp), T-DMR1 (−1188 to −790 bp), C-promoter (−2099 to −1876 bp), and T-DMR2 (−2953 to −2302 bp) were analyzed by sodium bisulfite genomic sequencing in the tissue samples of endometrium, mammary gland, placenta, and skin. Open and filled circles indicate unmethylated and methylated CpG status, respectively. The percentage of the methylated CpG sites in a total of the examined CpG sites was shown. The location of each upstream exon and CpG sites are shown with the distance from TSS of upstream Exon-A. A–C are upstream Exon-A, Exon-B, and Exon-C, respectively.
Figure 4.
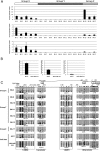
Figure 4.. DNA methylation statuses around upstream exons and mRNA expression of ESR1 variants in breast cancer.
A, ESR1 mRNA expressions of variant1, variant2, and variant3 were determined by real-time qRT-PCR using primers shown in Figure 3B in 17 breast cancer tissues. According to the mRNA expression pattern of the variants, 17 tissue samples were classified into 3 groups. Group X is the group which showed transcription of all 3 variants. Group Y is the group which showed no transcription of any variants. Group Z is the group which showed transcription of variant1 and variant2. mRNA expression was defined as positive when the ratio of mRNA of each variant to GAPDH is more than 0.3 according to the expression level of the mammary gland shown in Figure 3D. B, ESR1 mRNA expression levels in MCF7 and MDA-MB-231. Expression levels were examined by qRT-PCR. C, DNA methylation statuses of AB-promoter (−556 to +229 bp), T-DMR1 (−1188 to −790 bp), C-promoter (−2099 to −1876 bp), and T-DMR2 (−2953 to −2302 bp) were analyzed by sodium bisulfite genomic sequencing in the tissue/cellular samples from group X (BK-3), group Y (BK-8, BK-10, BK-11, BK-12, and BK-13), group Z (BK-17), MCF7, and MDA-MB-231. Open and filled circles indicate unmethylated and methylated CpG status, respectively. The percentage of the methylated CpG sites in a total of the examined CpG sites was shown. The location of each upstream Exon and CpG sites are shown with the distance from TSS of upstream Exon-A. A–C are upstream Exon-A, Exon-B, and Exon-C, respectively.
Figure 5.
Figure 5.. Regulation of ESR1 expression by EGR1 and binding statuses of EGR1 at T-DMRs.
A, Motif analysis was performed in T-DMR1 and T-DMR2 using Multiple Em for Motif Eliciation (MEME), which is a motif-based sequence analysis tool. The underlined sequences are the possible binding sites of EGR1, whose consensus sequence is shown below. B, Effects of EGR1 knockdown on ESR1 expression. EGR1 siRNA was transfected into human ESCs, which express ESR1. Protein expressions of EGR1 and ESR1 were analyzed by Western blotting in ESC treated with EGR1 siRNA or control siRNA. β-Tubulin was used as an internal control. The immunoblot is a representative of 3 independent incubations. ESR1 mRNA expression was analyzed by quantitative RT-PCR. The values are mean ± SEM of 3 independent incubations. *, P < .05. C, The binding statuses of EGR1 to T-DMR1 and T-DMR2 in ESC and MDA-MB-231. The binding statuses were examined by a ChIP assay. *, P < .05.

Similar articles

Cited by

References

    1. Ciocca DR, Roig LM. Estrogen receptors in human nontarget tissues: biological and clinical implications. Endocr Rev. 1995;16:35–62. - PubMed
    1. Grandien K, Berkenstam A, Gustafsson JA. The estrogen receptor gene: promoter organization and expression. Int J Biochem Cell Biol. 1997;29:1343–1369. - PubMed
    1. Takizawa T, Nakashima K, Namihira M, et al. . DNA methylation is a critical cell-intrinsic determinant of astrocyte differentiation in the fetal brain. Dev Cell. 2001;1:749–758. - PubMed
    1. Maier H, Colbert J, Fitzsimmons D, Clark DR, Hagman J. Activation of the early B-cell-specific mb-1 (Ig-α) gene by Pax-5 is dependent on an unmethylated Ets binding site. Mol Cell Biol. 2003;23:1946–1960. - PMC - PubMed
    1. Hark AT, Schoenherr CJ, Katz DJ, Ingram RS, Levorse JM, Tilghman SM. CTCF mediates methylation-sensitive enhancer-blocking activity at the H19/Igf2 locus. Nature. 2000;405:486–489. - PubMed

Publication types

MeSH terms

Grants and funding

This work was supported in part by JSPS KAKENHI Grants 24592471, 24791704, 24791705, 25293343, 25462559, 25462560, 25861495, 26670726, 26861328, 26861329, 26861330, and 26462492 for Scientific Research from the Ministry of Education, Science, and Culture, Japan, New Yobimizu project of Yamaguchi University, and Takeda Science Foundation.