

Chemo-enzymatic synthesis of site-specific isotopically labeled nucleotides for use in NMR resonance assignment, dynamics and structural characterizations
- PMID: 26657632
- PMCID: PMC4824079
- DOI: 10.1093/nar/gkv1333
Chemo-enzymatic synthesis of site-specific isotopically labeled nucleotides for use in NMR resonance assignment, dynamics and structural characterizations
Abstract
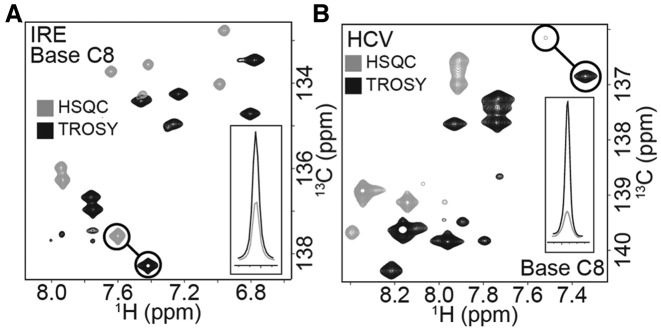
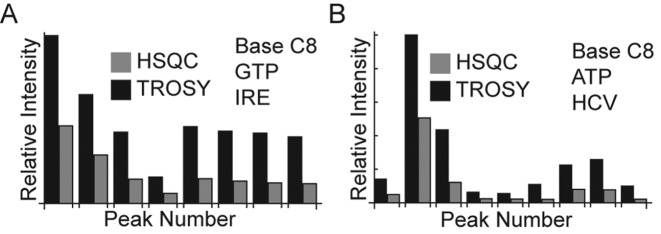
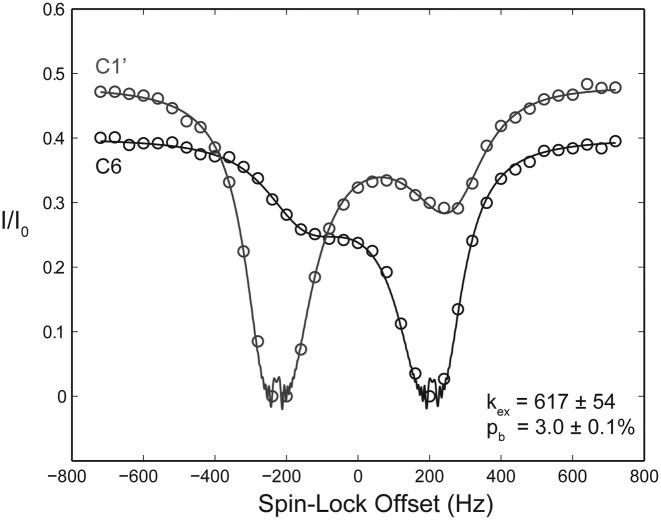
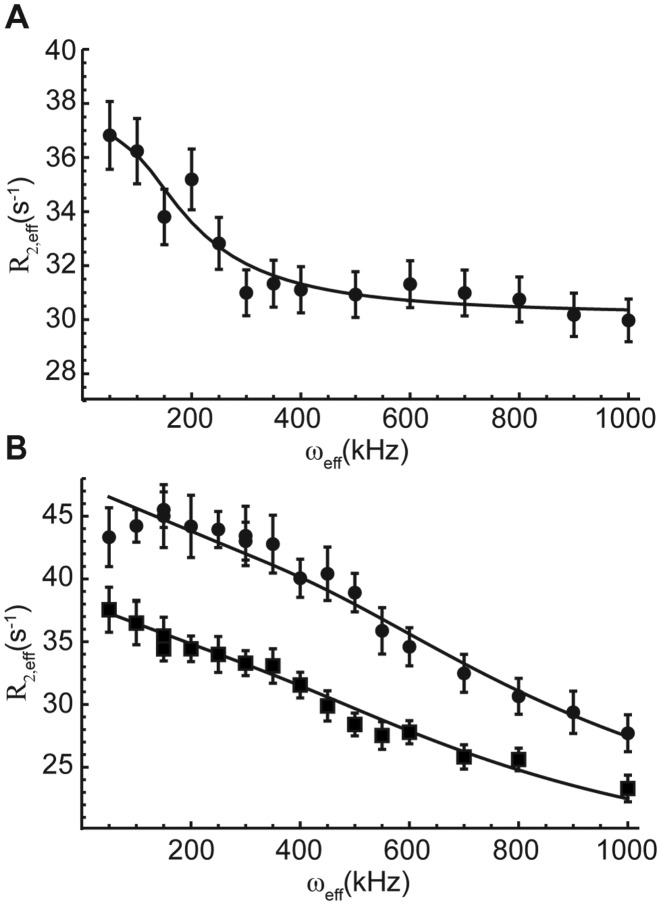
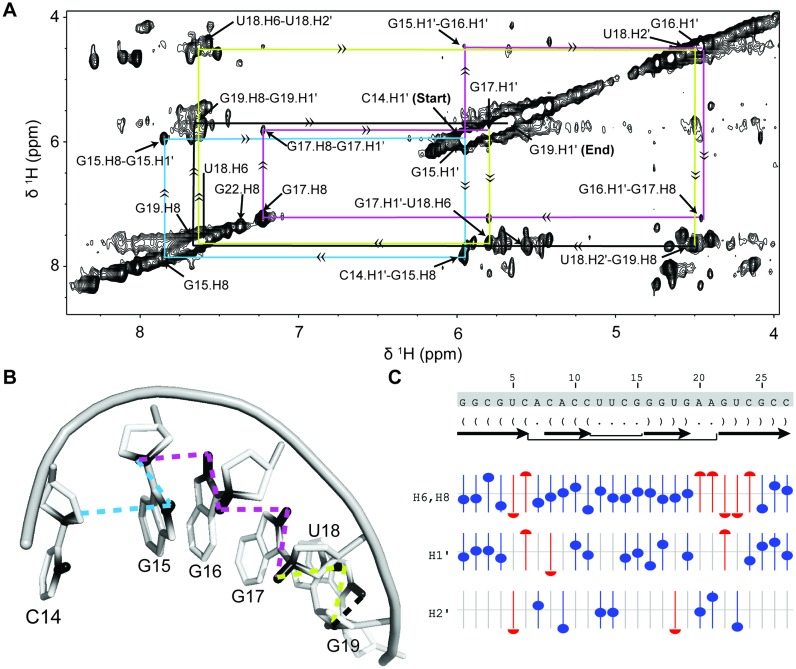
Stable isotope labeling is central to NMR studies of nucleic acids. Development of methods that incorporate labels at specific atomic positions within each nucleotide promises to expand the size range of RNAs that can be studied by NMR. Using recombinantly expressed enzymes and chemically synthesized ribose and nucleobase, we have developed an inexpensive, rapid chemo-enzymatic method to label ATP and GTP site specifically and in high yields of up to 90%. We incorporated these nucleotides into RNAs with sizes ranging from 27 to 59 nucleotides using in vitro transcription: A-Site (27 nt), the iron responsive elements (29 nt), a fluoride riboswitch from Bacillus anthracis(48 nt), and a frame-shifting element from a human corona virus (59 nt). Finally, we showcase the improvement in spectral quality arising from reduced crowding and narrowed linewidths, and accurate analysis of NMR relaxation dispersion (CPMG) and TROSY-based CEST experiments to measure μs-ms time scale motions, and an improved NOESY strategy for resonance assignment. Applications of this selective labeling technology promises to reduce difficulties associated with chemical shift overlap and rapid signal decay that have made it challenging to study the structure and dynamics of large RNAs beyond the 50 nt median size found in the PDB.
© The Author(s) 2015. Published by Oxford University Press on behalf of Nucleic Acids Research.
Figures
Similar articles
-
Chemo-enzymatic synthesis of selectively ¹³C/¹⁵N-labeled RNA for NMR structural and dynamics studies.Methods Enzymol. 2014;549:133-62. doi: 10.1016/B978-0-12-801122-5.00007-6. Methods Enzymol. 2014. PMID: 25432748 Free PMC article.
-
Regio-selective chemical-enzymatic synthesis of pyrimidine nucleotides facilitates RNA structure and dynamics studies.Chembiochem. 2014 Jul 21;15(11):1573-7. doi: 10.1002/cbic.201402130. Epub 2014 Jun 20. Chembiochem. 2014. PMID: 24954297 Free PMC article.
-
Noncovalent spin labeling of riboswitch RNAs to obtain long-range structural NMR restraints.ACS Chem Biol. 2014 Jun 20;9(6):1330-9. doi: 10.1021/cb500050t. Epub 2014 Apr 10. ACS Chem Biol. 2014. PMID: 24673892
-
Chemo-enzymatic labeling for rapid assignment of RNA molecules.Methods. 2016 Jul 1;103:11-7. doi: 10.1016/j.ymeth.2016.03.015. Epub 2016 Apr 18. Methods. 2016. PMID: 27090003 Review.
-
Stable isotope labeling methods for DNA.Prog Nucl Magn Reson Spectrosc. 2016 Aug;96:89-108. doi: 10.1016/j.pnmrs.2016.06.001. Epub 2016 Jun 20. Prog Nucl Magn Reson Spectrosc. 2016. PMID: 27573183 Review.
Cited by
-
Structural Biology for the Molecular Insight between Aptamers and Target Proteins.Int J Mol Sci. 2021 Apr 15;22(8):4093. doi: 10.3390/ijms22084093. Int J Mol Sci. 2021. PMID: 33920991 Free PMC article. Review.
-
Coupling between conformational dynamics and catalytic function at the active site of the lead-dependent ribozyme.RNA. 2018 Nov;24(11):1542-1554. doi: 10.1261/rna.067579.118. Epub 2018 Aug 15. RNA. 2018. PMID: 30111534 Free PMC article.
-
Synthesis and incorporation of 13C-labeled DNA building blocks to probe structural dynamics of DNA by NMR.Nucleic Acids Res. 2017 Sep 6;45(15):9178-9192. doi: 10.1093/nar/gkx592. Nucleic Acids Res. 2017. PMID: 28911104 Free PMC article.
-
Assigning NMR spectra of RNA, peptides and small organic molecules using molecular network visualization software.J Biomol NMR. 2019 Nov;73(10-11):525-529. doi: 10.1007/s10858-019-00271-3. Epub 2019 Jul 19. J Biomol NMR. 2019. PMID: 31325088 Free PMC article.
-
Dynamically regulated two-site interaction of viral RNA to capture host translation initiation factor.Nat Commun. 2023 Aug 28;14(1):4977. doi: 10.1038/s41467-023-40582-6. Nat Commun. 2023. PMID: 37640715 Free PMC article.
References
-
- Winkler W., Nahvi A., Breaker R.R. Thiamine derivatives bind messenger RNAs directly to regulate bacterial gene expression. Nature. 2002;419:952–956. - PubMed
-
- Reining A., Nozinovic S., Schlepckow K., Buhr F., Fürtig B., Schwalbe H. Three-state mechanism couples ligand and temperature sensing in riboswitches. Nature. 2013;499:355–359. - PubMed
Publication types
MeSH terms
Substances
Grants and funding
LinkOut - more resources
Full Text Sources
Other Literature Sources
Research Materials
