

The quantitative and condition-dependent Escherichia coli proteome
- PMID: 26641532
- PMCID: PMC4888949
- DOI: 10.1038/nbt.3418
The quantitative and condition-dependent Escherichia coli proteome
Abstract
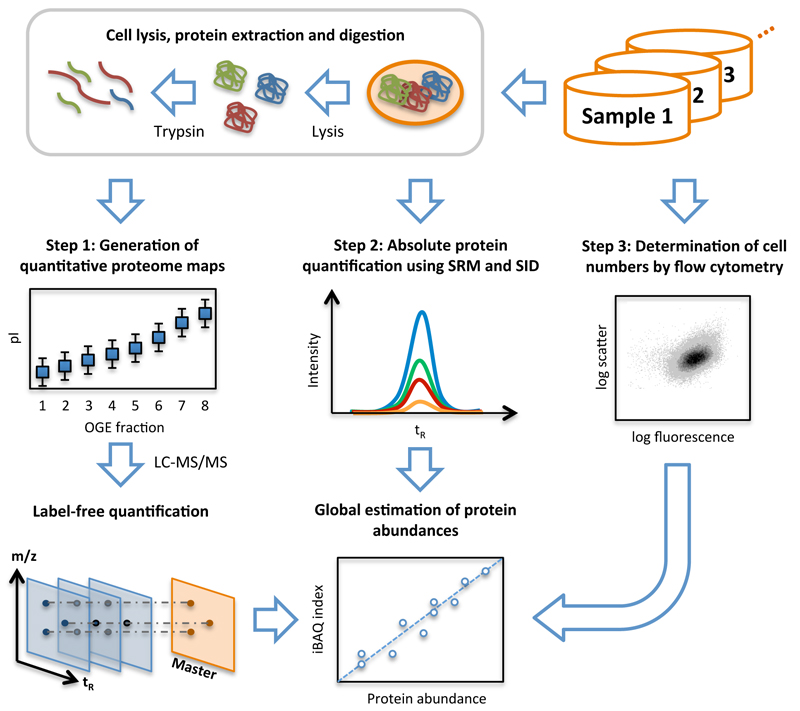
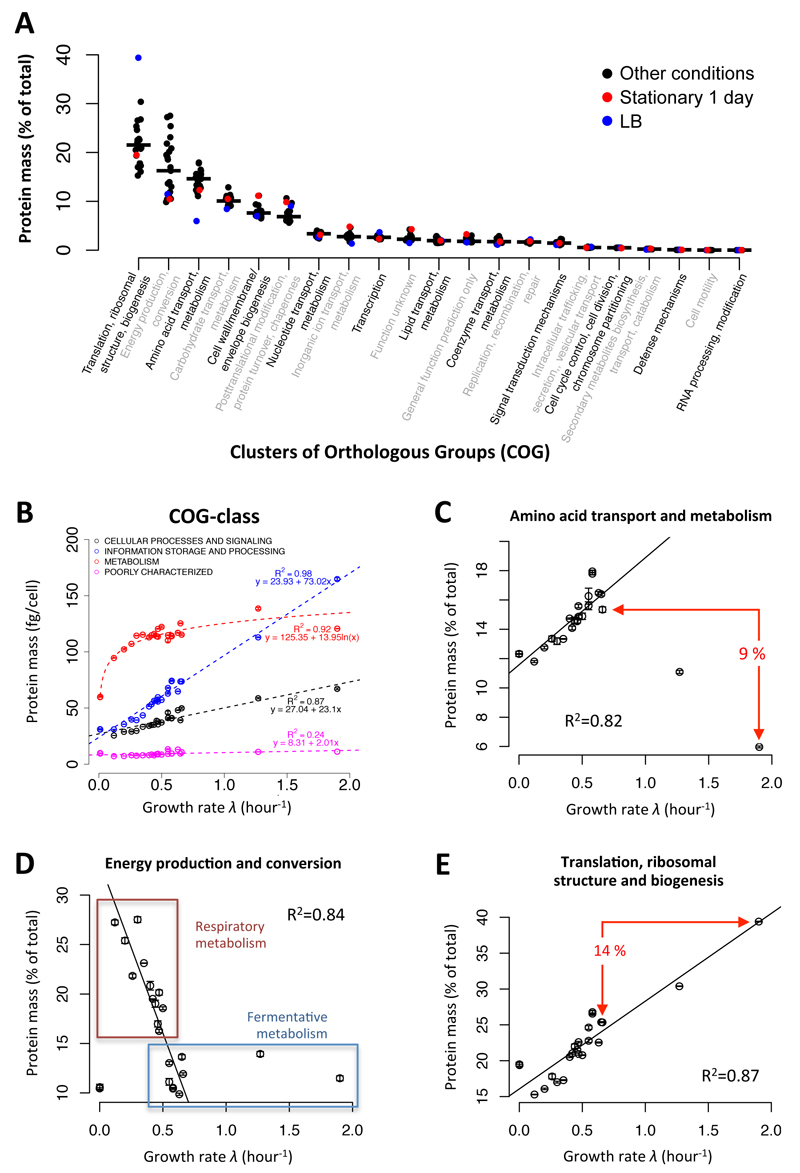
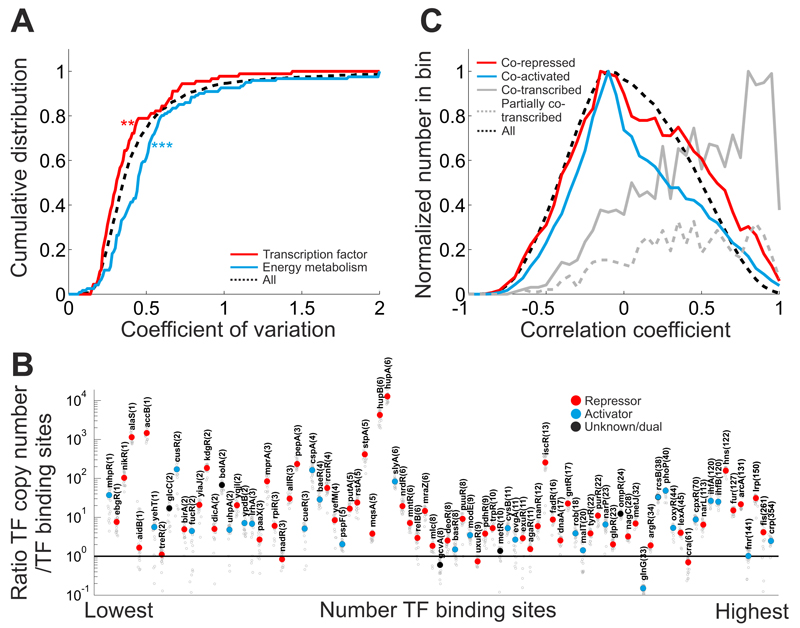
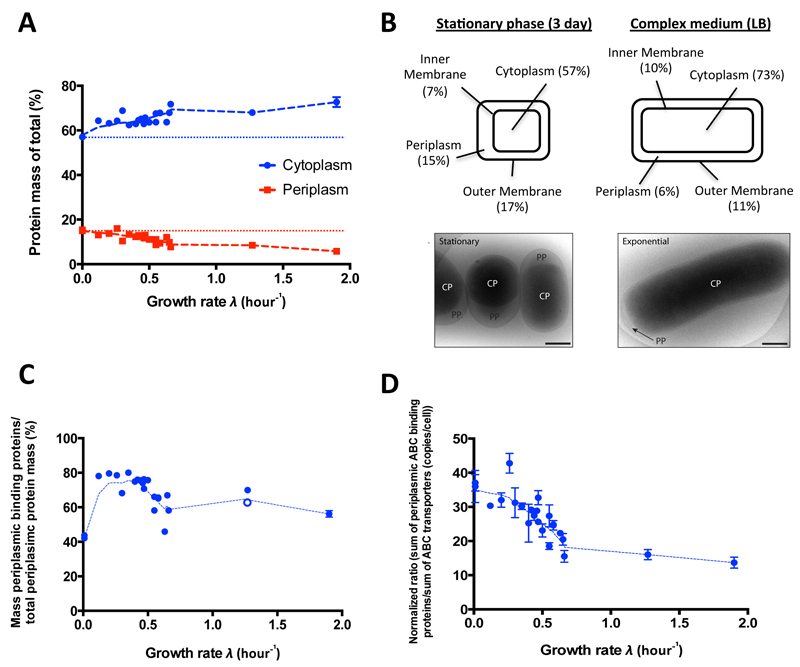
Measuring precise concentrations of proteins can provide insights into biological processes. Here we use efficient protein extraction and sample fractionation, as well as state-of-the-art quantitative mass spectrometry techniques to generate a comprehensive, condition-dependent protein-abundance map for Escherichia coli. We measure cellular protein concentrations for 55% of predicted E. coli genes (>2,300 proteins) under 22 different experimental conditions and identify methylation and N-terminal protein acetylations previously not known to be prevalent in bacteria. We uncover system-wide proteome allocation, expression regulation and post-translational adaptations. These data provide a valuable resource for the systems biology and broader E. coli research communities.
Conflict of interest statement
The authors declare that they have no competing interests as defined by Nature Publishing Group, or other interests that might be perceived to influence the results and/or discussion reported in this paper.
Figures

Similar articles
-
Overflow metabolism in Escherichia coli results from efficient proteome allocation.Nature. 2015 Dec 3;528(7580):99-104. doi: 10.1038/nature15765. Nature. 2015. PMID: 26632588 Free PMC article.
-
Proteome-wide analysis of protein carboxy termini: C terminomics.Nat Methods. 2010 Jul;7(7):508-11. doi: 10.1038/nmeth.1467. Epub 2010 Jun 6. Nat Methods. 2010. PMID: 20526347
-
From coarse to fine: the absolute Escherichia coli proteome under diverse growth conditions.Mol Syst Biol. 2021 May;17(5):e9536. doi: 10.15252/msb.20209536. Mol Syst Biol. 2021. PMID: 34032011 Free PMC article.
-
Escherichia coli Small Proteome.EcoSal Plus. 2020 May;9(1):10.1128/ecosalplus.ESP-0031-2019. doi: 10.1128/ecosalplus.ESP-0031-2019. EcoSal Plus. 2020. PMID: 32385980 Free PMC article. Review.
-
Computational and experimental approaches to chart the Escherichia coli cell-envelope-associated proteome and interactome.FEMS Microbiol Rev. 2009 Jan;33(1):66-97. doi: 10.1111/j.1574-6976.2008.00141.x. Epub 2008 Nov 27. FEMS Microbiol Rev. 2009. PMID: 19054114 Free PMC article. Review.
Cited by
-
Shaping bacterial gene expression by physiological and proteome allocation constraints.Nat Rev Microbiol. 2023 May;21(5):327-342. doi: 10.1038/s41579-022-00818-6. Epub 2022 Nov 14. Nat Rev Microbiol. 2023. PMID: 36376406 Free PMC article. Review.
-
Single-molecule insight into stalled replication fork rescue in Escherichia coli.Nucleic Acids Res. 2021 May 7;49(8):4220-4238. doi: 10.1093/nar/gkab142. Nucleic Acids Res. 2021. PMID: 33744948 Free PMC article. Review.
-
Intramolecular Interactions Dominate the Autoregulation of Escherichia coli Stringent Factor RelA.Front Microbiol. 2019 Aug 27;10:1966. doi: 10.3389/fmicb.2019.01966. eCollection 2019. Front Microbiol. 2019. PMID: 31507571 Free PMC article.
-
Pervasive Transcription-coupled DNA repair in E. coli.Nat Commun. 2022 Mar 30;13(1):1702. doi: 10.1038/s41467-022-28871-y. Nat Commun. 2022. PMID: 35354807 Free PMC article.
-
Drop-off-reinitiation triggered by EF-G-driven mistranslocation and its alleviation by EF-P.Nucleic Acids Res. 2022 Mar 21;50(5):2736-2753. doi: 10.1093/nar/gkac068. Nucleic Acids Res. 2022. PMID: 35188576 Free PMC article.
References
-
- Schwanhäusser B, et al. Global quantification of mammalian gene expression control. Nature. 2011;473:337–342. - PubMed
Publication types
MeSH terms
Substances
Grants and funding
LinkOut - more resources
Full Text Sources
Other Literature Sources
Molecular Biology Databases
