. 2015 Dec 3:5:17568.
doi: 10.1038/srep17568.

TET-catalyzed 5-hydroxymethylcytosine regulates gene expression in differentiating colonocytes and colon cancer

Affiliations

TET-catalyzed 5-hydroxymethylcytosine regulates gene expression in differentiating colonocytes and colon cancer

Christopher G Chapman et al. Sci Rep. .

Erratum in

Abstract

The formation of differentiated cell types from pluripotent progenitors involves epigenetic regulation of gene expression. DNA hydroxymethylation results from the enzymatic oxidation of 5-methylcytosine (5-mC) to 5-hydroxymethylcytosine (5-hmC) by the ten-eleven translocation (TET) 5-mC dioxygenase enzymes. Previous work has mapped changes in 5-mC during differentiation of intestinal stem cells. However, whether or not 5-hmC regulates colonocyte differentiation is unknown. Here we show that 5-hmC regulates gene expression during colonocyte differentiation and controls gene expression in human colon cancers. Genome-wide profiling of 5-hmC during in vitro colonic differentiation demonstrated that 5-hmC is gained at highly expressed and induced genes and is associated with intestinal transcription factor binding sites, including those for HNF4A and CDX2. TET1 induction occurred during differentiation, and TET1 knockdown altered gene expression and inhibited barrier formation of colonocytes. We find that the 5-hmC distribution in primary human colonocytes parallels the distribution found in differentiated cells in vitro, and that gene-specific 5-hmC changes in human colon cancers are directly correlated with changes in gene expression. Our results support a model in which 5-hmC regulates differentiation of adult human intestine and 5-hmC alterations contribute to the disrupted gene expression in colon cancer.


Conflict of interest statement

The authors declare no competing financial interests.

Figures
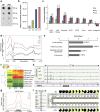
Figure 1
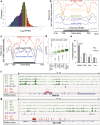
Figure 1. 5-hmC is gained during differentiation at epithelial associated genes and transcription factor binding sites.
(a) Dot blot analysis of 5-hmC quantity at days 0 and 15 of differentiation. Dot blot performed by biotinylation of 5-hmC followed by probing with Avidin-HRP. Dot blot representative of three replicates. (b) The number of bases covered by 5-hmC peaks at each day of differentiation. Data represent averages from two replicates. (c) Enrichment of 5-hmC at different genomic annotations. For each time point, enrichment is determined by calculating the observed overlap of hMe-Seal sequencing tags with each genomic element and then dividing this number by the expected value of overlap assuming a random distribution of 5-hmC. See methods for details. Error bars represent standard deviations of two replicates. *p < 0.001 in random permutation tests. (d) The 5-hmC profile over an average RefSeq gene at each time point. Data represent one replicate, for correlation between replicates see Fig. S1. (e) KEGG pathway analysis of genes with 5-hmC peaks at day 15. Values to the right of bar graphs represent FDR-corrected p-values. (f) Enrichment of 5-hmC at early and late binding sites of GATA6, CDX2, and HNF4A as well as positions marked by H3K4me2. hMe-Seal data acquired in T84 cells. Positions of GATA6, CDX2, HNF4A, and H3K4me2 were previously determined by ChIP-seq in proliferating and differentiated Caco2 cells (GSE23436). Enrichment values calculated by random permutation tests. (g) hMe-Seal sequencing profile around late HNF4A binding sites. hMe-Seal performed in T84 cells. HNF4A binding sites in differentiated Caco2 cells were previously published (GSE23436). (h) hMe-Seal and HNF4A ChIP-seq data at RXRA. hMe-Seal data acquired using T84 cells. HNF4A ChIP-seq data are from differentiated Caco2 cells (GSE23436). (i) TAB-seq data from the region shaded in (h) (hg19; chr9:137,220,139-137,220,610). From left to right, each pie chart represents a single CpG. Pie charts represent percent 5-mC (black), 5-hmC (green), and cytosine (gold). Percent 5-mC, 5-hmC, and cytosine were calculated following sequencing of at least 16 clones generated by PCR amplification of bisulfite or Tet-oxidized and bisulfite treated DNA. P-values calculated by chi-squared tests. See also Fig. S1 and Table S1.
Figure 2
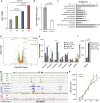
Figure 2. 5-hmC is associated with highly expressed and induced genes.
(a,b) Genes were separated by expression level at day 15 (a) and their 5-hmC profiles were plotted (b). The number of genes included in each subgroup is indicated in parentheses. (c) 5-hmC profile of upregulated, downregulated, and unchanged genes. The number of genes included in each subgroup is indicated in parentheses. (d,e) Genes were separated by 5-hmC density (see Fig. S2b) and expression level of these genes at day 15 (d) and percent of these genes up- or down-regulated over the time course (e) are plotted. The number of genes included in each subgroup is indicated in parentheses. P-value calculated by chi-squared test. (f,g) Examples of genes that gain expression and 5-hmC. HNF4A ChIP-seq data represent a previously published data set obtained from differentiated Caco2 cells (GSE23436). Genome-wide sequencing data presented in Fig. 2 are representative of one of two biological replicates. For correlation between replicates, see Figure S1.
Figure 3
Figure 3. TET1 regulates gene expression in differentiating T84 cells.
(a) TET1 expression over the differentiation time course measured by RNA-seq in fragments per kilobase of transcript per million mapped reads (FPKM). Q-values represent FDR-adjusted p-values outputted by Cuffdiff. RNA-seq data from two biological replicates were used as input into the Cuffdiff program. (b) T84 cells stably expressing a TET1 targeting shRNA were generated using lentivirus. TET1 knockdown was quantified by qPCR (n = 3). Error bars represent standard deviations. P-value calculated by Student’s t-test. (c) GO cellular compartment analysis of all dysregulated genes in shTET1 relative to shCtrl cells at day 15. Values to the right of bar graphs represent FDR-corrected p-values. (d) Volcano plot analysis of differentially expressed genes between shTET1 and shCtrl cells at day 15. Analysis includes only genes with hydroxymethylation at day 15. Data represent analysis of RNA-seq data from two biological replicates. Fold change and p-values were outputted from Cuffdiff. (e,f) RNA-seq measured expression of selected genes with both hydroxymethylation and differential expression at day 15. Expression is measured as FPKM. Test statistics are FDR-corrected outputs from Cuffdiff analysis using two biological replicates, *q < 0.05, **q < 0.01. (g) Integration of 5-hMe-Seal data acquired in differentiating T84 cells with other epigenetic features at SLC26A3. Data for histone ChIP-seq and ChromHMM segmentation were obtained from ENCODE data sets from HepG2 cells (GSM798321, GSM733693, GSM33743). HNF4A ChIP-seq data represent a previously published dataset acquired using differentiated Caco2 cells differentiated (GSE23436). (h) TER measurements for T84 cells expressing a control or TET1 targeting hairpin. Error bars represent standard deviations, p-value calculated by Student’s t-test (n = 3). See also Figure S3.
Figure 4
Figure 4. 5-hmC regulates similar genes in vivo and is dysregulated in colon cancer.
(a) Comparison of genomic regions covered by 5-hmC in differentiated colonocytes in vitro and primary human patient samples. Overlap is measured in number of bases with a called peak in both the in vivo and in vitro samples. Analysis was performed by first identifying regions with peaks in both normal patient samples and then comparing these positions to regions with peaks in both T84 cell replicates at day 15. (b) Comparison of genes with 5-hmC peaks in differentiated colonocytes in vitro and primary human patient samples. Genes with 5-hmC peaks were identified as any gene having a peak called by MACS1.4 in its gene body. Genes with peaks in both normal patient samples were identified and compared with genes with peaks in both T84 cell replicates. (c,d) Expression of selected genes losing and gaining 5-hmC in cancer. Data acquired from the TCGA. Units of expression are RNA-seq by expectation-maximization (RSEM). Test statistics were calculated by Wilcoxon rank-sum tests. **p < 0.001 following Bonferonni correction. (e–h) Examples of genes that lose and gain 5-hmC in paired tumor and adjacent normal samples. N1, N2 normal 1 and 2; T1, T2 tumor 1 and 2. (I,j) TAB-seq results of the region denoted in (g) and (h) (hg19; chr6:122,890,582-122,890,851 and chr1:240,622,715-240,622,914). From left to right, each pie chart represents a single CpG at day 0 or day 15. In pie charts, black represents 5-mC, green represents 5-hmC, and gold represents cytosine. Experiments performed using independent patient samples. P-values calculated by chi-squared tests. See also Figure S4.

Similar articles

Cited by

References

    1. Hammoud S. S., Cairns B. R. & Jones D. A. Epigenetic regulation of colon cancer and intestinal stem cells. Current opinion in cell biology 10.1016/j.ceb.2013.01.007 (2013). - DOI - PMC - PubMed
    1. Tahiliani M. et al. Conversion of 5-methylcytosine to 5-hydroxymethylcytosine in mammalian DNA by MLL partner TET1. Science 324, 930–935 (2009). - PMC - PubMed
    1. Kriaucionis S. & Heintz N. The nuclear DNA base 5-hydroxymethylcytosine is present in Purkinje neurons and the brain. Science 324, 929–930 (2009). - PMC - PubMed
    1. Ito S. et al. Tet Proteins Can Convert 5-Methylcytosine to 5-Formylcytosine and 5-Carboxylcytosine. Science 333, 1300–1303 (2011). - PMC - PubMed
    1. He Y. F. et al. Tet-Mediated Formation of 5-Carboxylcytosine and Its Excision by TDG in Mammalian DNA. Science 333, 1303–1307 (2011). - PMC - PubMed

Publication types

MeSH terms