

Engineering high-affinity PD-1 variants for optimized immunotherapy and immuno-PET imaging
- PMID: 26604307
- PMCID: PMC4664306
- DOI: 10.1073/pnas.1519623112
Engineering high-affinity PD-1 variants for optimized immunotherapy and immuno-PET imaging
Abstract
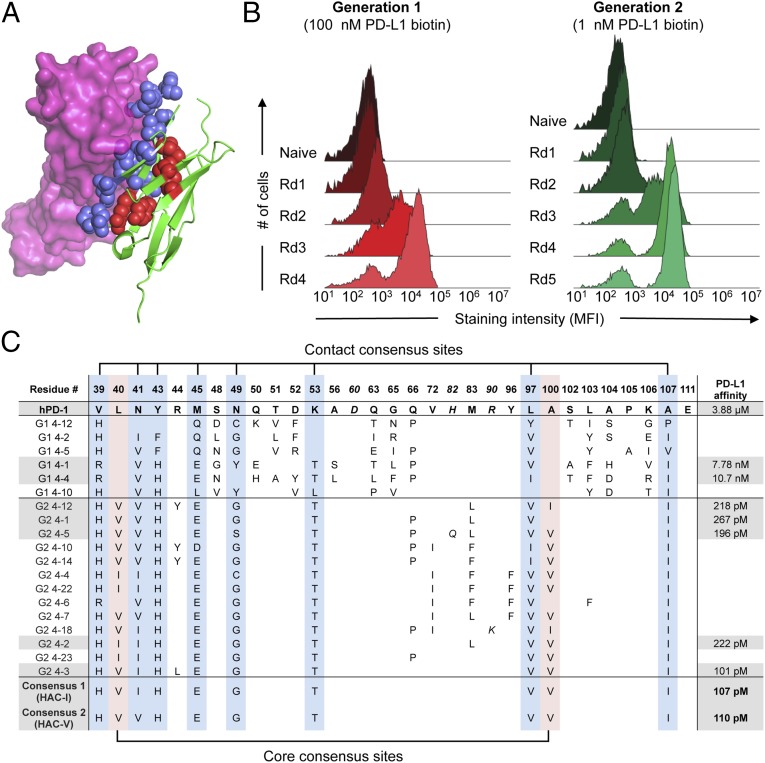
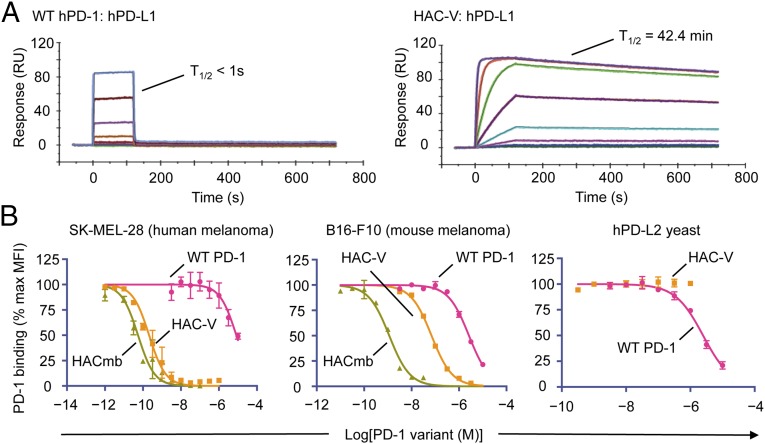
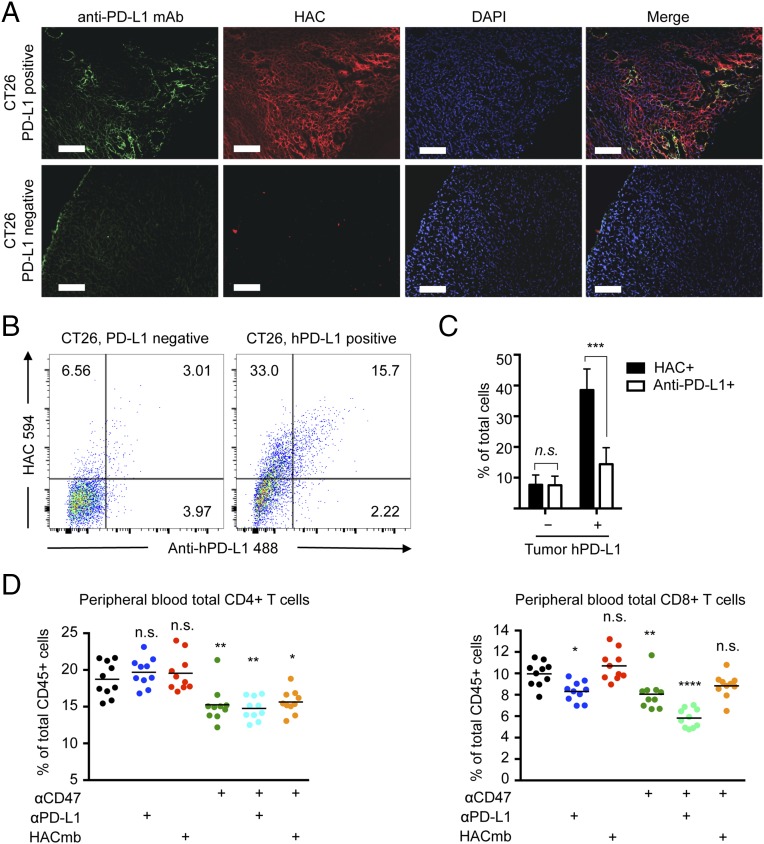
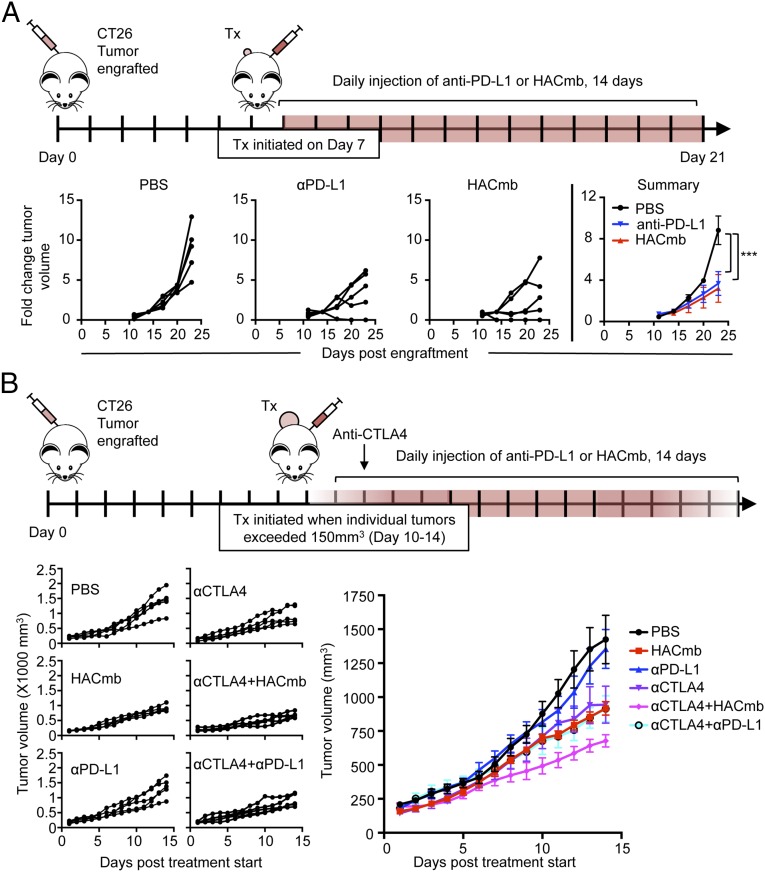
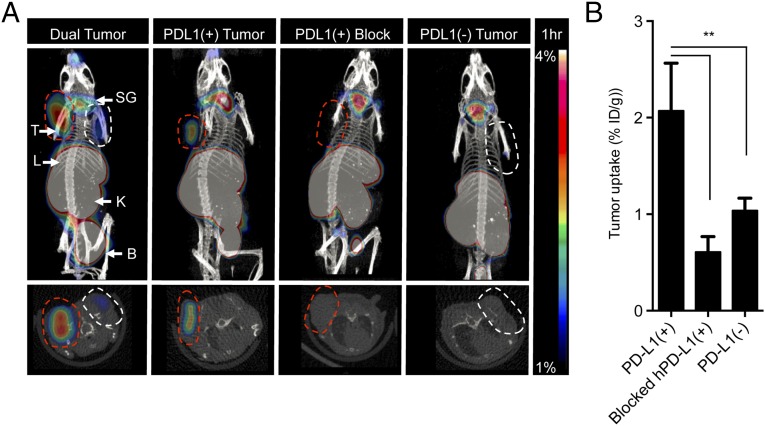
Signaling through the immune checkpoint programmed cell death protein-1 (PD-1) enables tumor progression by dampening antitumor immune responses. Therapeutic blockade of the signaling axis between PD-1 and its ligand programmed cell death ligand-1 (PD-L1) with monoclonal antibodies has shown remarkable clinical success in the treatment of cancer. However, antibodies have inherent limitations that can curtail their efficacy in this setting, including poor tissue/tumor penetrance and detrimental Fc-effector functions that deplete immune cells. To determine if PD-1:PD-L1-directed immunotherapy could be improved with smaller, nonantibody therapeutics, we used directed evolution by yeast-surface display to engineer the PD-1 ectodomain as a high-affinity (110 pM) competitive antagonist of PD-L1. In contrast to anti-PD-L1 monoclonal antibodies, high-affinity PD-1 demonstrated superior tumor penetration without inducing depletion of peripheral effector T cells. Consistent with these advantages, in syngeneic CT26 tumor models, high-affinity PD-1 was effective in treating both small (50 mm(3)) and large tumors (150 mm(3)), whereas the activity of anti-PD-L1 antibodies was completely abrogated against large tumors. Furthermore, we found that high-affinity PD-1 could be radiolabeled and applied as a PET imaging tracer to efficiently distinguish between PD-L1-positive and PD-L1-negative tumors in living mice, providing an alternative to invasive biopsy and histological analysis. These results thus highlight the favorable pharmacology of small, nonantibody therapeutics for enhanced cancer immunotherapy and immune diagnostics.
Keywords: PD-1; PD-L1; PET imaging; cancer immunotherapy; protein engineering.
Conflict of interest statement
Conflict of interest statement: A.M.R., R.L.M., A.C.K., A.M., S.R.G., M.N.M., and I.L.W. are inventors of patents related to the high-affinity PD-1 proteins described in this manuscript. S.R.G. provides paid consulting services for Ab Initio Biotherapeutics, Inc., which licensed the aforementioned patents. A.M.R., R.L.M., A.C.K., and A.M. are founders of Ab Initio Biotherapeutics, Inc.
Figures
Similar articles
-
Practical Immuno-PET Radiotracer Design Considerations for Human Immune Checkpoint Imaging.J Nucl Med. 2017 Apr;58(4):538-546. doi: 10.2967/jnumed.116.177659. Epub 2016 Dec 15. J Nucl Med. 2017. PMID: 27980047 Free PMC article.
-
Nuclear imaging-guided PD-L1 blockade therapy increases effectiveness of cancer immunotherapy.J Immunother Cancer. 2020 Nov;8(2):e001156. doi: 10.1136/jitc-2020-001156. J Immunother Cancer. 2020. PMID: 33203663 Free PMC article.
-
Agonist redirected checkpoint, PD1-Fc-OX40L, for cancer immunotherapy.J Immunother Cancer. 2018 Dec 18;6(1):149. doi: 10.1186/s40425-018-0454-3. J Immunother Cancer. 2018. PMID: 30563566 Free PMC article.
-
Therapeutic uses of anti-PD-1 and anti-PD-L1 antibodies.Int Immunol. 2015 Jan;27(1):39-46. doi: 10.1093/intimm/dxu095. Epub 2014 Oct 16. Int Immunol. 2015. PMID: 25323844 Review.
-
Immunomodulators targeting the PD-1/PD-L1 protein-protein interaction: From antibodies to small molecules.Med Res Rev. 2019 Jan;39(1):265-301. doi: 10.1002/med.21530. Epub 2018 Sep 14. Med Res Rev. 2019. PMID: 30215856 Review.
Cited by
-
The RESP AI model accelerates the identification of tight-binding antibodies.Nat Commun. 2023 Jan 28;14(1):454. doi: 10.1038/s41467-023-36028-8. Nat Commun. 2023. PMID: 36709319 Free PMC article.
-
Molecular imaging for cancer immunotherapy.Immunooncol Technol. 2020 Mar 27;5:10-21. doi: 10.1016/j.iotech.2020.03.001. eCollection 2020 Mar. Immunooncol Technol. 2020. PMID: 35756142 Free PMC article. Review.
-
Development of [18F]FPy-WL12 as a PD-L1 Specific PET Imaging Peptide.Mol Imaging. 2019 Jan-Dec;18:1536012119852189. doi: 10.1177/1536012119852189. Mol Imaging. 2019. PMID: 31187691 Free PMC article.
-
Modeling Oncolytic Viral Therapy, Immune Checkpoint Inhibition, and the Complex Dynamics of Innate and Adaptive Immunity in Glioblastoma Treatment.Front Physiol. 2020 Mar 3;11:151. doi: 10.3389/fphys.2020.00151. eCollection 2020. Front Physiol. 2020. PMID: 32194436 Free PMC article.
-
mRNA Display Discovery of a Novel Programmed Death Ligand 1 (PD-L1) Binding Peptide (a Peptide Ligand for PD-L1).ACS Chem Biol. 2020 Jun 19;15(6):1630-1641. doi: 10.1021/acschembio.0c00264. Epub 2020 Apr 30. ACS Chem Biol. 2020. PMID: 32352272 Free PMC article.
References
-
- Hanahan D, Weinberg RA. Hallmarks of cancer: The next generation. Cell. 2011;144(5):646–674. - PubMed
-
- Chemnitz JM, Parry RV, Nichols KE, June CH, Riley JL. SHP-1 and SHP-2 associate with immunoreceptor tyrosine-based switch motif of programmed death 1 upon primary human T cell stimulation, but only receptor ligation prevents T cell activation. J Immunol. 2004;173(2):945–954. - PubMed
Publication types
MeSH terms
Substances
Grants and funding
LinkOut - more resources
Full Text Sources
Other Literature Sources
Research Materials
