

Atomic-resolution structure of the CAP-Gly domain of dynactin on polymeric microtubules determined by magic angle spinning NMR spectroscopy
- PMID: 26604305
- PMCID: PMC4664305
- DOI: 10.1073/pnas.1509852112
Atomic-resolution structure of the CAP-Gly domain of dynactin on polymeric microtubules determined by magic angle spinning NMR spectroscopy
Abstract
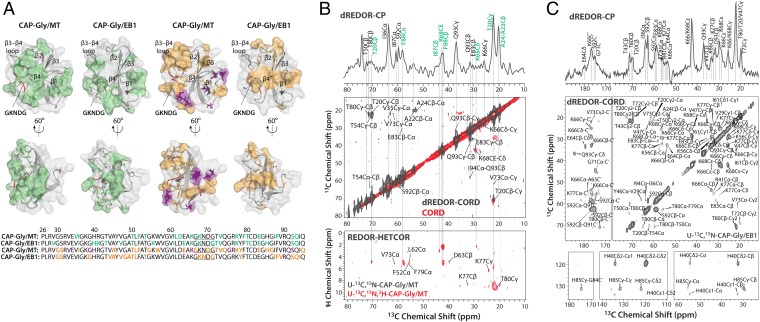
Microtubules and their associated proteins perform a broad array of essential physiological functions, including mitosis, polarization and differentiation, cell migration, and vesicle and organelle transport. As such, they have been extensively studied at multiple levels of resolution (e.g., from structural biology to cell biology). Despite these efforts, there remain significant gaps in our knowledge concerning how microtubule-binding proteins bind to microtubules, how dynamics connect different conformational states, and how these interactions and dynamics affect cellular processes. Structures of microtubule-associated proteins assembled on polymeric microtubules are not known at atomic resolution. Here, we report a structure of the cytoskeleton-associated protein glycine-rich (CAP-Gly) domain of dynactin motor on polymeric microtubules, solved by magic angle spinning NMR spectroscopy. We present the intermolecular interface of CAP-Gly with microtubules, derived by recording direct dipolar contacts between CAP-Gly and tubulin using double rotational echo double resonance (dREDOR)-filtered experiments. Our results indicate that the structure adopted by CAP-Gly varies, particularly around its loop regions, permitting its interaction with multiple binding partners and with the microtubules. To our knowledge, this study reports the first atomic-resolution structure of a microtubule-associated protein on polymeric microtubules. Our approach lays the foundation for atomic-resolution structural analysis of other microtubule-associated motors.
Keywords: dynactin's CAP-Gly domain; intermolecular interface determination; magic angle spinning NMR; microtubules; structure determination.
Conflict of interest statement
The authors declare no conflict of interest.
Figures


Similar articles
-
Internal dynamics of dynactin CAP-Gly is regulated by microtubules and plus end tracking protein EB1.J Biol Chem. 2015 Jan 16;290(3):1607-22. doi: 10.1074/jbc.M114.603118. Epub 2014 Dec 1. J Biol Chem. 2015. PMID: 25451937 Free PMC article.
-
Three-dimensional structure of CAP-gly domain of mammalian dynactin determined by magic angle spinning NMR spectroscopy: conformational plasticity and interactions with end-binding protein EB1.J Mol Biol. 2013 Nov 15;425(22):4249-66. doi: 10.1016/j.jmb.2013.04.027. Epub 2013 May 4. J Mol Biol. 2013. PMID: 23648839 Free PMC article.
-
Solid-state and solution NMR studies of the CAP-Gly domain of mammalian dynactin and its interaction with microtubules.J Am Chem Soc. 2009 Jul 29;131(29):10113-26. doi: 10.1021/ja902003u. J Am Chem Soc. 2009. PMID: 19580321
-
Capturing protein tails by CAP-Gly domains.Trends Biochem Sci. 2008 Nov;33(11):535-45. doi: 10.1016/j.tibs.2008.08.006. Epub 2008 Oct 4. Trends Biochem Sci. 2008. PMID: 18835717 Review.
-
Dynactin.Annu Rev Cell Dev Biol. 2004;20:759-79. doi: 10.1146/annurev.cellbio.20.012103.094623. Annu Rev Cell Dev Biol. 2004. PMID: 15473859 Review.
Cited by
-
Fast Magic-Angle Spinning 19 F NMR Spectroscopy of HIV-1 Capsid Protein Assemblies.Angew Chem Int Ed Engl. 2018 Dec 10;57(50):16375-16379. doi: 10.1002/anie.201809060. Epub 2018 Oct 19. Angew Chem Int Ed Engl. 2018. PMID: 30225969 Free PMC article.
-
Accuracy and precision of protein structures determined by magic angle spinning NMR spectroscopy: for some 'with a little help from a friend'.J Biomol NMR. 2019 Jul;73(6-7):333-346. doi: 10.1007/s10858-019-00233-9. Epub 2019 Mar 7. J Biomol NMR. 2019. PMID: 30847635 Free PMC article.
-
Chemical Shifts of the Carbohydrate Binding Domain of Galectin-3 from Magic Angle Spinning NMR and Hybrid Quantum Mechanics/Molecular Mechanics Calculations.J Phys Chem B. 2018 Mar 22;122(11):2931-2939. doi: 10.1021/acs.jpcb.8b00853. Epub 2018 Mar 13. J Phys Chem B. 2018. PMID: 29498857 Free PMC article.
-
Solid-state NMR spectroscopy.Nat Rev Methods Primers. 2021;1:2. doi: 10.1038/s43586-020-00002-1. Epub 2021 Jan 14. Nat Rev Methods Primers. 2021. PMID: 34368784 Free PMC article.
-
Mapping protein-protein interactions by double-REDOR-filtered magic angle spinning NMR spectroscopy.J Biomol NMR. 2017 Feb;67(2):95-108. doi: 10.1007/s10858-016-0086-1. Epub 2017 Jan 24. J Biomol NMR. 2017. PMID: 28120201 Free PMC article.
References
-
- Vale RD. The molecular motor toolbox for intracellular transport. Cell. 2003;112(4):467–480. - PubMed
-
- Huszar D, Theoclitou ME, Skolnik J, Herbst R. Kinesin motor proteins as targets for cancer therapy. Cancer Metastasis Rev. 2009;28(1-2):197–208. - PubMed
-
- Puls I, et al. Mutant dynactin in motor neuron disease. Nat Genet. 2003;33(4):455–456. - PubMed
Publication types
MeSH terms
Substances
Associated data
- Actions
Grants and funding
LinkOut - more resources
Full Text Sources
Other Literature Sources
Research Materials
Miscellaneous
