. 2015 Nov 24;11(11):e1005288.
doi: 10.1371/journal.ppat.1005288. eCollection 2015.

The Transcription and Translation Landscapes during Human Cytomegalovirus Infection Reveal Novel Host-Pathogen Interactions

Affiliations

The Transcription and Translation Landscapes during Human Cytomegalovirus Infection Reveal Novel Host-Pathogen Interactions

Osnat Tirosh et al. PLoS Pathog. .

Abstract

Viruses are by definition fully dependent on the cellular translation machinery, and develop diverse mechanisms to co-opt this machinery for their own benefit. Unlike many viruses, human cytomegalovirus (HCMV) does suppress the host translation machinery, and the extent to which translation machinery contributes to the overall pattern of viral replication and pathogenesis remains elusive. Here, we combine RNA sequencing and ribosomal profiling analyses to systematically address this question. By simultaneously examining the changes in transcription and translation along HCMV infection, we uncover extensive transcriptional control that dominates the response to infection, but also diverse and dynamic translational regulation for subsets of host genes. We were also able to show that, at late time points in infection, translation of viral mRNAs is higher than that of cellular mRNAs. Lastly, integration of our translation measurements with recent measurements of protein abundance enabled comprehensive identification of dozens of host proteins that are targeted for degradation during HCMV infection. Since targeted degradation indicates a strong biological importance, this approach should be applicable for discovering central host functions during viral infection. Our work provides a framework for studying the contribution of transcription, translation and degradation during infection with any virus.


Conflict of interest statement

The authors have declared that no competing interests exist.

Figures

Fig 1
Fig 1. Experimental approach for mapping mRNA abundance and protein production rate through the course of HCMV infection.
A. Primary fibroblasts were infected with HCMV and harvested at different times after infection for ribosome footprints and RNA-seq analysis. B. Reproducibility of the ribosome occupancies and mRNA measurements of host genes at 72hpi. The correlations in footprints and mRNA measurements between biological replicates are presented.
Fig 2
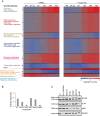
Fig 2. Changes in cellular gene expression during HCMV infection.
A. Ribosome footprints and mRNA read densities (reads per kilobase million, RPKM) of well-expressed human transcripts after treatment with interferon (IFN), infection with inactivated virus (5hr UV) and across four time points during HCMV infection were calculated relative to expression in uninfected cells (mock). Shown is heat map of log2 expression ratios after partitioning clustering. The ten main clusters are marked and for each of these clusters the pathway enrichment (Benjamini < 1E-5) is labeled on the left. B. Cells transfected with a control or siRNAs targeting different host genes were infected with the Merlin strain (MOI = 3). After 5 days supernatants were collected and viral titers were calculated by TCID50. Each experiment was performed in triplicates and results shown are representative. C. Samples from experiments detailed in (B) were analyzed by western blot for viral proteins expression from immediate early, early and late stages of infection (IE1/IE2, UL44 and pp28, respectively).
Fig 3
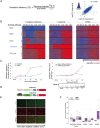
Fig 3. Dynamic changes in translation efficiency of cellular genes during HCMV infection.
A. TE was calculated by dividing RPKM of ribosome footprints with RPKM of mRNA measurements and the correlation in TE of host genes between biological replicates is represented. B. TE of 731 human transcripts after interferon (IFN) treatment, infection with inactivated virus (5hr UV) and during HCMV infection were calculated relative to TE in uninfected cells. The TE ratios were subjected to partitioning clustering and shown is the heat map of log2 TE ratios and the corresponding footprints and mRNAs ratios. The five clusters are marked and for each of these clusters the pathway enrichment (P-val < 1E-4) is labeled on the left. C. HSP90AB1 mRNA and footprints levels as measured in our RNA-seq and ribosome profiling experiment (left panel) and verification of these measurements by real-time PCR and western blot analysis (right panel). Real-Time PCR data was normalized by the amount of polr2l mRNA. D. Schematic representation of the live cell translation reporter. An inducible degron (DHFR-Y100I) fused to sfGFP-NLS is separated from an NLS-mCherry protein by a P2A ribosome skipping sequence, which allows these two proteins to be synthesized separately from a single transcript. In the absence of the stabilizer, trimethoprim (TMP), sfGFP-NLS is degraded, while NLS-mCherry is stable. Upon addition of TMP, DHFR-sfGFP-NLS is stabilized and GFP fluorescence increases over time due to GFP protein synthesis, thus providing readout for TE. E. HFF cells stably expressing the reporter were treated with 3 μM TMP and then imaged every 60 min. As can be seen in representative images the GFP intensity increases over time, while the mCherry signal remains constant. F. 5’ UTRs of indicated genes were cloned upstream of the GFP, and HFF cells stably expressing these constructs were created. To measure translation cells were either infected with HCMV for 24hr or left uninfected, then TMP was added to the infected and uninfected cells and the cells were imaged for 3hr. The increase in GFP fluorescence was measured and normalized (see Methods). Shown boxplot represent the GFP accumulation, cells expressing the 5’UTRs of RPS19, SMC2 and RAD50 showed significant higher accumulation of GFP in infected cells compared to uninfected (* P-val < 0.05).
Fig 4
Fig 4. Differences in translation efficiency between viral and human genes along HCMV infection.
A. Cumulative TE distribution among well-expressed human and viral genes shows that viral genes are translated less efficiently than cellular genes at 5hpi but more efficiently at 72hpi. P-values were calculated by Kolmogorov Smirnov test. B. The percentage of mRNA and footprints reads that maps to the virus are plotted along infection.
Fig 5
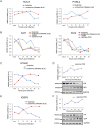
Fig 5. Integration between ribosome footprints and protein abundance allows detection of immune ligands that are degraded during infection.
A. Ribosome profiling measurements for HLA-A and the NK ligand PVRL2 compared with temporal protein expression measured [12]. B. Expression of FAT1 and FAT4 measured by ribosome profiling, RNA-seq and real-time PCR analysis compared with protein abundance [12]. C and E. Ribosome profiling measurements of BTN2A1 and IGSF8 compared with protein abundance [12], respectively. D and F. Real-time PCR analysis of btn2a1 (D) and igsf8 (F) mRNA levels along HCMV infection (upper panels). HFF cells stably expressing BTN2A1-HA or IGSF8-HA were infected with HCMV. Protein levels were detected by western blot analysis using anti-HA antibody (lower panels). GFP levels (expressed from the same vector) were used as internal control. Real-time PCR data was normalized by the amount of mfge8 mRNA. Each experiment was performed in triplicates.
Fig 6
Fig 6. Identification of viral proteins responsible for BTN2A1 and IGSF8 degradation.
A. HFF cells stably expressing BTN2A1-HA or IGSF8-HA were transduced with lentiviral vector expressing either US2, US9 or empty vector. BTN2A1 and IGSF8 protein levels were measured by immunoblotting. Right panel represents the quantification of IGSF8 expression relative to GAPDH amount from the same cells. B. HFF cells stably expressing BTN2A1-HA or IGSF8-HA were mock-infected or infected with HCMV AD169VarL, AD169VarL-BAC, AD169VarL-BACdeltaUS9 or AD169VarL-BAC deltaUL40 in MOI = 5 for 72 hr. BTN2A1 or IGSF8 protein levels were analyzed along infection by immunoblotting detection of the HA signal.
Fig 7
Fig 7. Integration between ribosome footprints and protein abundance measurements allows detection of cellular proteins that are degraded during HCMV infection.
A. Ribosome profiling measurements of ROCK1 and ERC1 compared with protein abundance [12].B. Real-time PCR analysis of rock1 and erc1 with parallel measurements of protein levels by western blot analysis. Real-time PCR data was normalized by the amount of mfge8 mRNA. Each experiment was performed in triplicates. Western blot analysis was performed on cell lysates and GAPDH was used as loading control. C. Cells were mock-infected or infected with HCMV for 48hr and cycloheximide (25μg/ml) was added to the medium to stop protein translation. Samples were taken at the indicated time points and the abundance of ROCK1 and ERC1 was determined by western blotting. D. Expression of ROCK1 and ERC1 along infection with AD169 HCMV strain. Protein levels were analyzed by western blotting.
Fig 8
Fig 8. pUL135 contributes to ROCK1 degradation.
A. Fluorescent microscopy images of cells expressing UL135 (GFP positive) and stained with ROCK1 antibody (rhodamine red X) (left panel). ROCK1 levels in 20 cells were quantified using Imaris (*p-val < 0.05) (right panel). B. HFF cells transduced with lentiviral vector expressing pUL135 under doxycycline inducible promotor were analyzed for ROCK1 expression levels, with or without the addition of doxycycline, using western blot analysis (left panel). Differences in protein levels were quantified using the Licor program (right panel). Error bar indicate the standard deviation in the ratio of ROCK1 expression in cells with and without doxycycline addition between two independent experiments. C. Measurements of rock1 mRNA levels in HFF transduced with pUL135 under doxycycline inducible promoter, 24 and 48 hours after addition of doxycycline. Each experiment was performed in triplicates and average results are presented. Error bars indicate standard deviation of the mean.

Similar articles

Cited by

References

    1. Davison AJ, Dolan A, Akter P, Addison C, Dargan DJ, Alcendor DJ, et al. The human cytomegalovirus genome revisited: comparison with the chimpanzee cytomegalovirus genome. J Gen Virol. 2003/01/21 ed. 2003;84: 17–28. - PubMed
    1. Murphy E, Rigoutsos I, Shibuya T, Shenk TE. Reevaluation of human cytomegalovirus coding potential. Proc Natl Acad Sci U S A. 2003/11/01 ed. 2003;100: 13585–13590. 10.1073/pnas.1735466100 1735466100 [pii] - DOI - PMC - PubMed
    1. Stern-Ginossar N, Weisburd B, Michalski A, Le VT, Hein MY, Huang SX, et al. Decoding human cytomegalovirus. Science (80-). 2012/11/28 ed. 2012;338: 1088–1093. 10.1126/science.1227919 - DOI - PMC - PubMed
    1. Zhu H, Cong JP, Shenk T. Use of differential display analysis to assess the effect of human cytomegalovirus infection on the accumulation of cellular RNAs: induction of interferon-responsive RNAs. Proc Natl Acad Sci U S A. 1998/02/12 ed. 1997;94: 13985–13990. - PMC - PubMed
    1. Zhu H, Cong JP, Mamtora G, Gingeras T, Shenk T. Cellular gene expression altered by human cytomegalovirus: global monitoring with oligonucleotide arrays. Proc Natl Acad Sci U S A. 1998/11/25 ed. 1998;95: 14470–14475. - PMC - PubMed

Publication types

Grants and funding

This research was supported by a research grant from Mr. Ilan Gluzman, the Human Frontiers Science Program Career Development Award, the EU-FP7-PEOPLE Career integration grant, the ICORE (Chromatin and RNA Gene Regulation) and the Israeli Science Foundation (1073/14). GF is the incumbent of the David and Stacey Cynamon Research fellow Chair in Genetics and Personalized Medicine. MT and VTKLT received funding from the Deutsche Forschungsgemeinschaft (DFG) through TRR60 (project A7N) and GRK1949/1. The funders had no role in study design, data collection and analysis, decision to publish, or preparation of the manuscript.