Transcriptional Landscape of Cardiomyocyte Maturation
- PMID: 26586429
- PMCID: PMC4662925
- DOI: 10.1016/j.celrep.2015.10.032
Transcriptional Landscape of Cardiomyocyte Maturation
Abstract
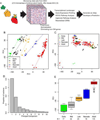
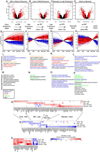
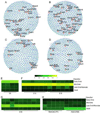
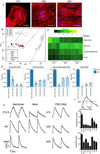
Decades of progress in developmental cardiology has advanced our understanding of the early aspects of heart development, including cardiomyocyte (CM) differentiation. However, control of the CM maturation that is subsequently required to generate adult myocytes remains elusive. Here, we analyzed over 200 microarray datasets from early embryonic to adult hearts and identified a large number of genes whose expression shifts gradually and continuously during maturation. We generated an atlas of integrated gene expression, biological pathways, transcriptional regulators, and gene regulatory networks (GRNs), which show discrete sets of key transcriptional regulators and pathways activated or suppressed during CM maturation. We developed a GRN-based program named MatStat(CM) that indexes CM maturation status. MatStat(CM) reveals that pluripotent-stem-cell-derived CMs mature early in culture but are arrested at the late embryonic stage with aberrant regulation of key transcription factors. Our study provides a foundation for understanding CM maturation.
Copyright © 2015 The Authors. Published by Elsevier Inc. All rights reserved.
Figures
Similar articles
-
Transcriptome analysis in cardiomyocyte-specific differentiation of murine embryonic stem cells reveals transcriptional regulation network.Gene Expr Patterns. 2014 Sep;16(1):8-22. doi: 10.1016/j.gep.2014.07.002. Epub 2014 Jul 21. Gene Expr Patterns. 2014. PMID: 25058891
-
Human cardiomyocyte generation from pluripotent stem cells: A state-of-art.Life Sci. 2016 Jan 15;145:98-113. doi: 10.1016/j.lfs.2015.12.023. Epub 2015 Dec 10. Life Sci. 2016. PMID: 26682938 Review.
-
Pitx2c modulates cardiac-specific transcription factors networks in differentiating cardiomyocytes from murine embryonic stem cells.Cells Tissues Organs. 2011;194(5):349-62. doi: 10.1159/000323533. Epub 2011 Mar 9. Cells Tissues Organs. 2011. PMID: 21389672
-
Cardiomyocytes derived from pluripotent stem cells: progress and prospects from China.Exp Cell Res. 2013 Jan 15;319(2):120-5. doi: 10.1016/j.yexcr.2012.09.011. Epub 2012 Sep 25. Exp Cell Res. 2013. PMID: 23022397 Review.
-
Proteomic Analysis of Human Pluripotent Stem Cell-Derived, Fetal, and Adult Ventricular Cardiomyocytes Reveals Pathways Crucial for Cardiac Metabolism and Maturation.Circ Cardiovasc Genet. 2015 Jun;8(3):427-36. doi: 10.1161/CIRCGENETICS.114.000918. Epub 2015 Mar 10. Circ Cardiovasc Genet. 2015. PMID: 25759434
Cited by
-
Heteromeric Solute Carriers: Function, Structure, Pathology and Pharmacology.Adv Exp Med Biol. 2021;21:13-127. doi: 10.1007/5584_2020_584. Adv Exp Med Biol. 2021. PMID: 33052588 Review.
-
Neddylation is required for perinatal cardiac development through stimulation of metabolic maturation.Cell Rep. 2023 Jan 31;42(1):112018. doi: 10.1016/j.celrep.2023.112018. Epub 2023 Jan 19. Cell Rep. 2023. PMID: 36662623 Free PMC article.
-
Hydrogel-Sheathed hiPSC-Derived Heart Microtissue Enables Anchor-Free Contractile Force Measurement.Adv Sci (Weinh). 2023 Dec;10(35):e2301831. doi: 10.1002/advs.202301831. Epub 2023 Oct 17. Adv Sci (Weinh). 2023. PMID: 37849230 Free PMC article.
-
Synergistic effects of hormones on structural and functional maturation of cardiomyocytes and implications for heart regeneration.Cell Mol Life Sci. 2023 Aug 5;80(8):240. doi: 10.1007/s00018-023-04894-6. Cell Mol Life Sci. 2023. PMID: 37541969 Free PMC article. Review.
-
ERRγ enhances cardiac maturation with T-tubule formation in human iPSC-derived cardiomyocytes.Nat Commun. 2021 Jun 21;12(1):3596. doi: 10.1038/s41467-021-23816-3. Nat Commun. 2021. PMID: 34155205 Free PMC article.
References
-
- Cao X, Wang J, Wang Z, Du J, Yuan X, Huang W, Meng J, Gu H, Nie Y, Ji B, et al. MicroRNA profiling during rat ventricular maturation: A role for miR-29a in regulating cardiomyocyte cell cycle re-entry. FEBS Lett. 2013;587:1548–1555. - PubMed
-
- Chan Y-C, Ting S, Lee Y-K, Ng K-M, Zhang J, Chen Z, Siu CW, Oh SKW, Tse H-F. Electrical stimulation promotes maturation of cardiomyocytes derived from human embryonic stem cells. J Cardiovasc Transl Res. 2013;6:989–999. - PubMed
Publication types
MeSH terms
Substances
Associated data
- Actions
Grants and funding
LinkOut - more resources
Full Text Sources
Other Literature Sources
Molecular Biology Databases
Miscellaneous

