
GLP-1 stimulates insulin secretion by PKC-dependent TRPM4 and TRPM5 activation

Makoto Shigeto et al. J Clin Invest. 2015 Dec.

Abstract

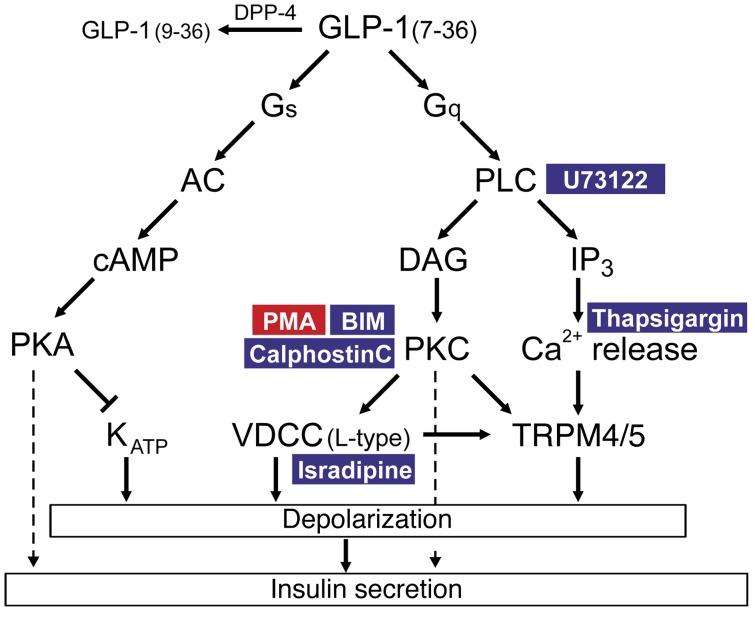
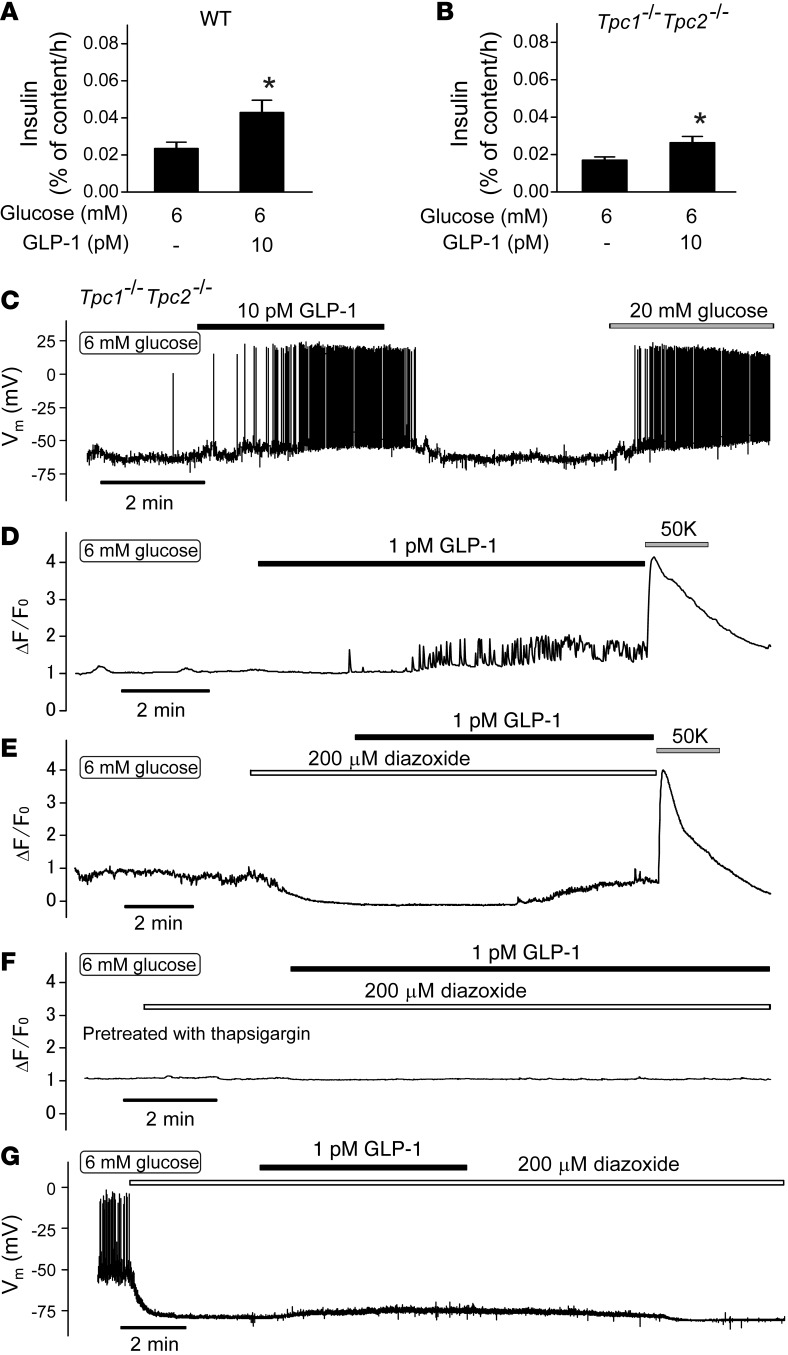
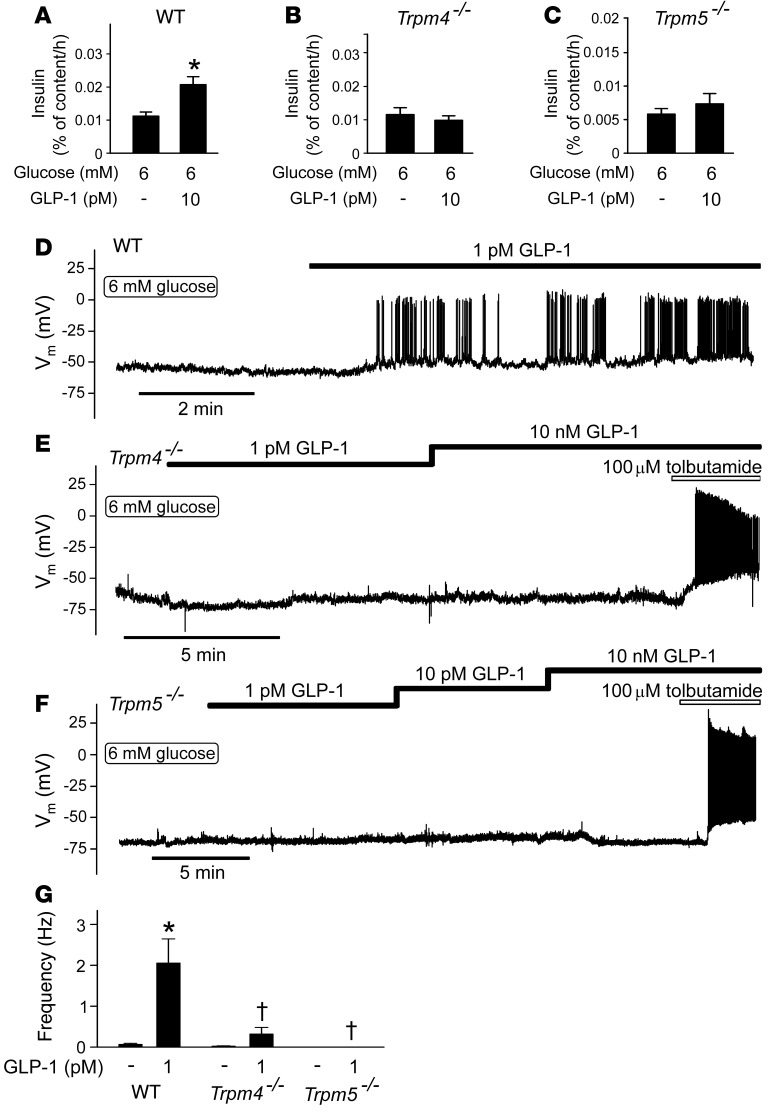
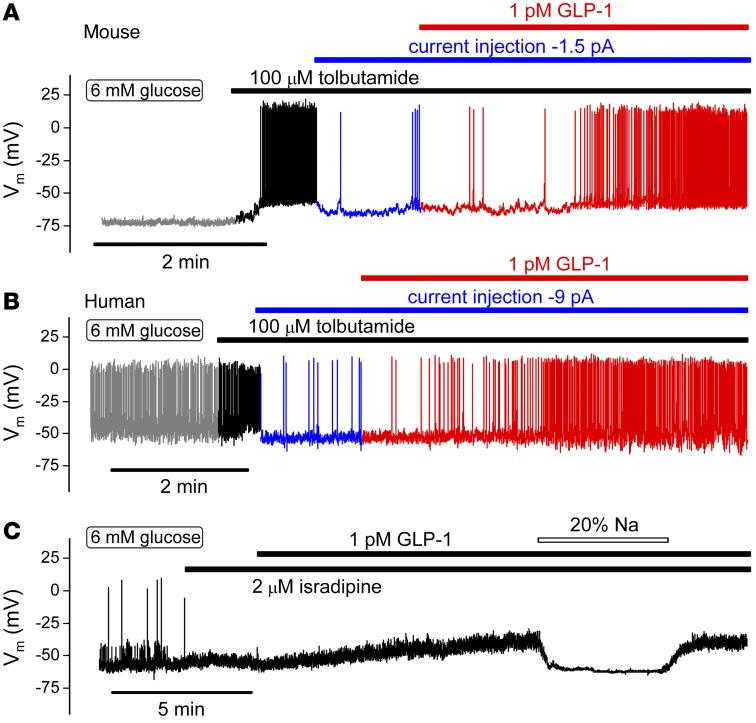
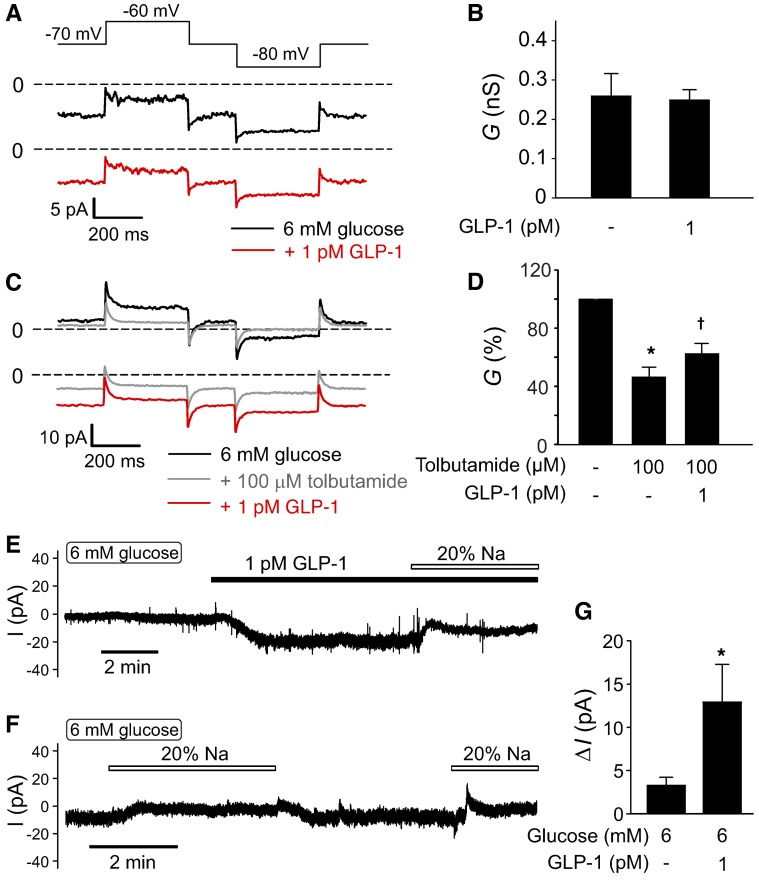
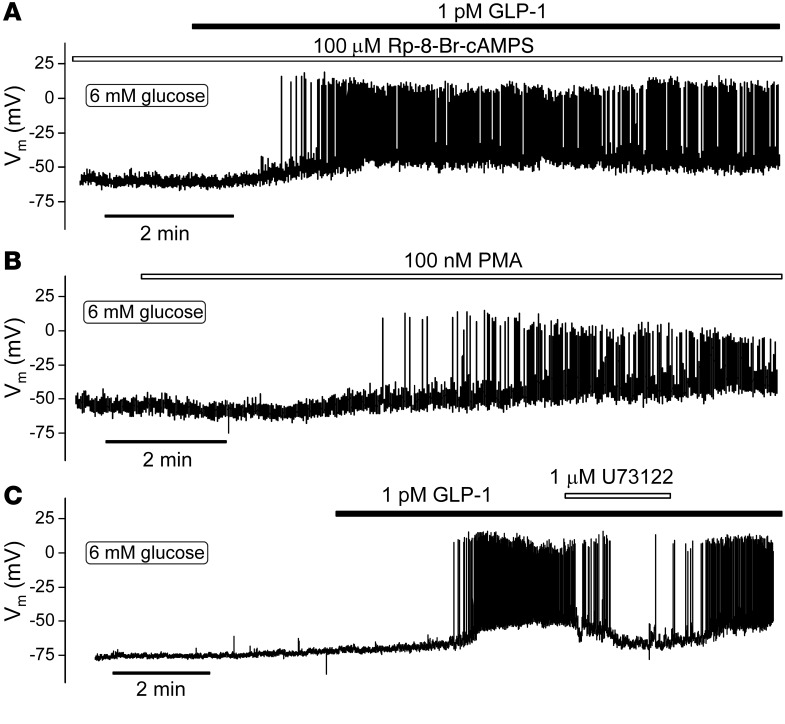
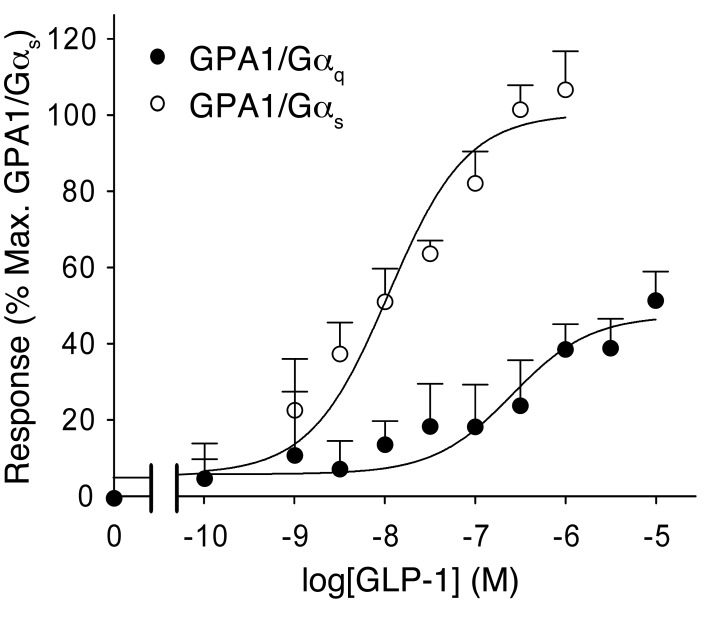
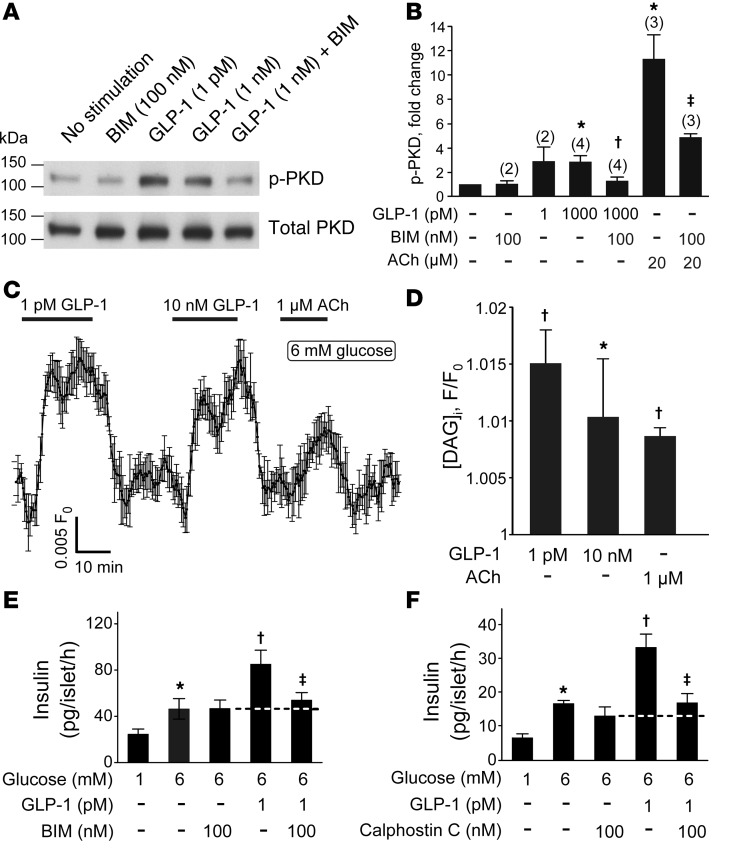
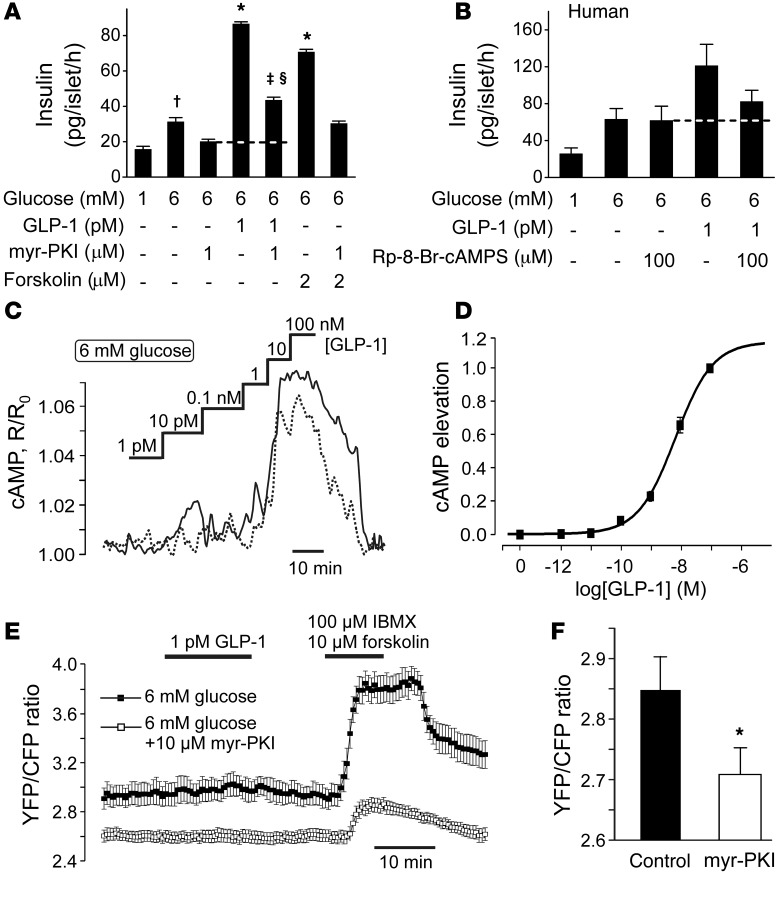
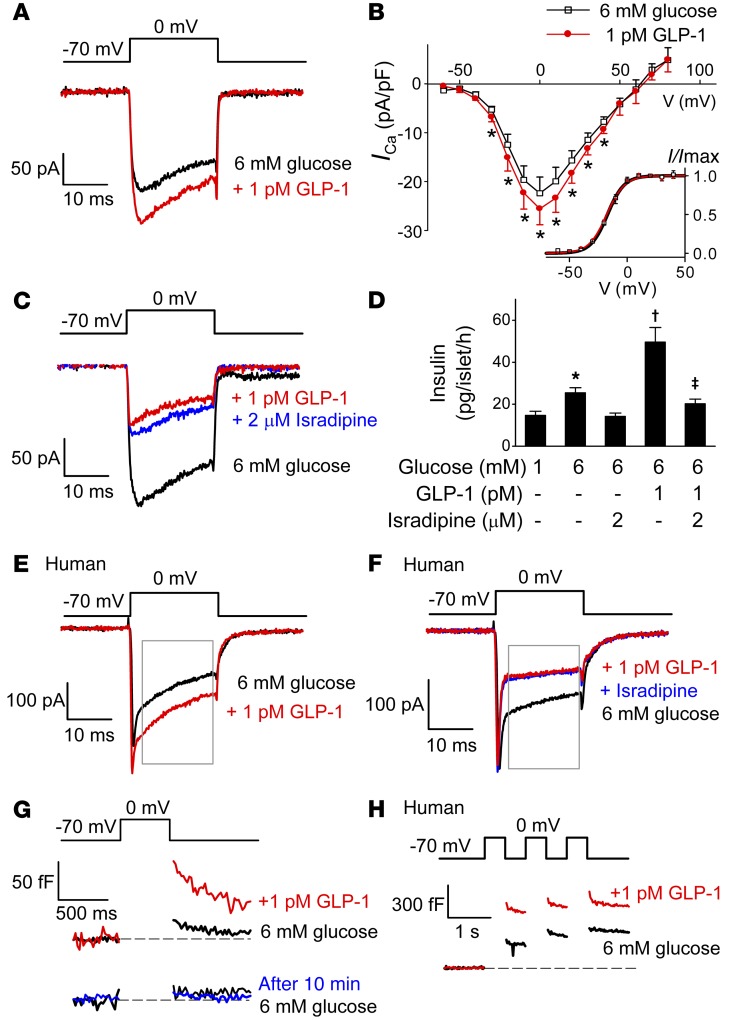
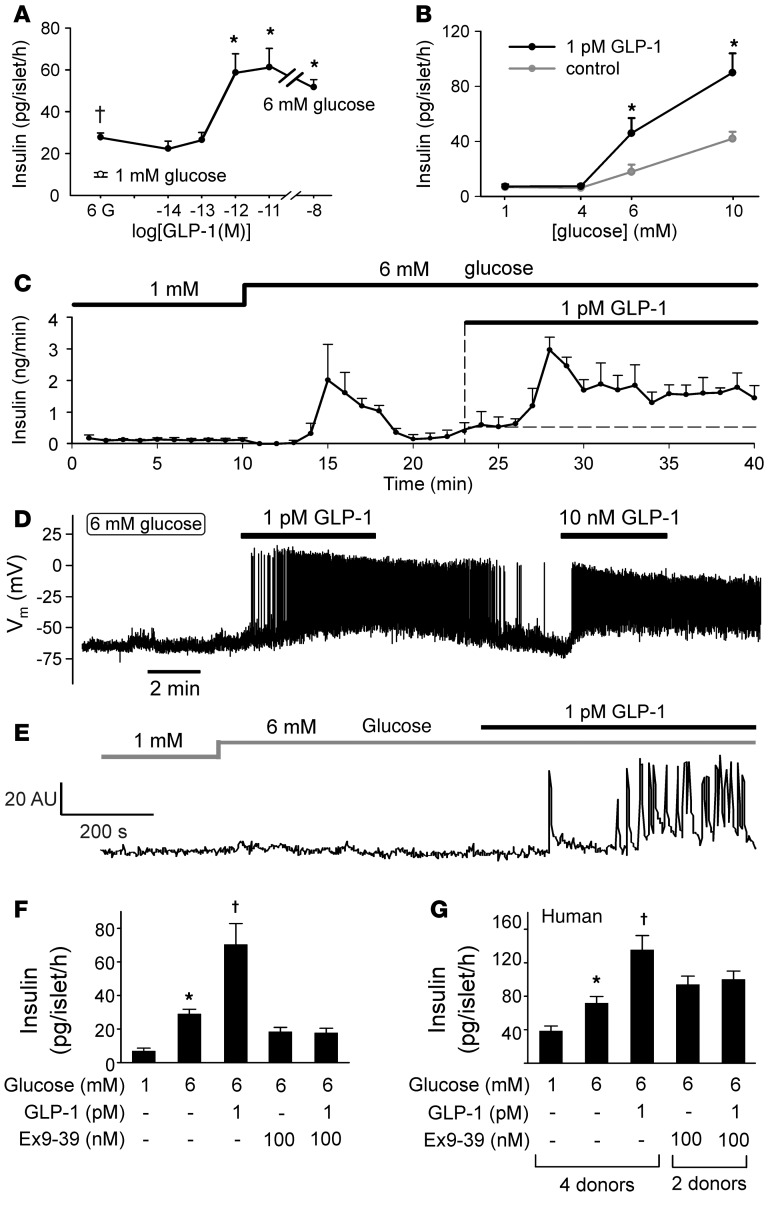
Strategies aimed at mimicking or enhancing the action of the incretin hormone glucagon-like peptide 1 (GLP-1) therapeutically improve glucose-stimulated insulin secretion (GSIS); however, it is not clear whether GLP-1 directly drives insulin secretion in pancreatic islets. Here, we examined the mechanisms by which GLP-1 stimulates insulin secretion in mouse and human islets. We found that GLP-1 enhances GSIS at a half-maximal effective concentration of 0.4 pM. Moreover, we determined that GLP-1 activates PLC, which increases submembrane diacylglycerol and thereby activates PKC, resulting in membrane depolarization and increased action potential firing and subsequent stimulation of insulin secretion. The depolarizing effect of GLP-1 on electrical activity was mimicked by the PKC activator PMA, occurred without activation of PKA, and persisted in the presence of PKA inhibitors, the KATP channel blocker tolbutamide, and the L-type Ca(2+) channel blocker isradipine; however, depolarization was abolished by lowering extracellular Na(+). The PKC-dependent effect of GLP-1 on membrane potential and electrical activity was mediated by activation of Na(+)-permeable TRPM4 and TRPM5 channels by mobilization of intracellular Ca(2+) from thapsigargin-sensitive Ca(2+) stores. Concordantly, GLP-1 effects were negligible in Trpm4 or Trpm5 KO islets. These data provide important insight into the therapeutic action of GLP-1 and suggest that circulating levels of this hormone directly stimulate insulin secretion by β cells.


Figures

Figure 11
Figure 11. Schematic summarizing the effects of GLP-1 on signal transduction pathways relevant to the stimulation of insulin secretion.
In addition to activating Gαs, GLP-1 also leads to activation of Gαq, leading to the activation of PLC and production of DAG, with resultant activation of PKC and elevation of [Ca2+]i by IP3-induced Ca2+ mobilization from thapsigargin-sensitive Ca2+ stores, which (together with the activation of PKC) results in activation of TRPM4 and TRPM5 channels, membrane depolarization, and initiation of action potential firing. GLP-1 also stimulates Ca2+ entry via L-type Ca2+ channels, but this effect is relatively small and is not sufficient to explain the initiation of electrical activity. Additionally, GLP-1 closes KATP channels, accounting for the weak depolarization that persists at low extracellular Na+ and in some Trpm4–/– and Trpm5–/– β cells. Low concentrations of GLP also enhanced depolarization-evoked exocytosis, but this effect requires electrical activity/Ca2+ entry to operate. This also explains why PKC inhibition leads to complete loss of insulin secretion stimulated by GLP-1. This is because, unless electrical activity is initiated, these distal effects will not operate. In the schematic, pharmacological activators and inhibitors are highlighted in red and blue, respectively. AC, adenylyl cyclase; VDCC, voltage-dependent Ca2+ channels.
Figure 10
Figure 10. GLP-1 mobilizes intracellular Ca2+.
(A and B) Effects of GLP-1 (10 pM) on insulin secretion in islets from (A) wild-type and (B) Tpc1 Tpc2 DKO mice exposed to 6 mM glucose (n = 7–8 islets from 6–7 mice). *P < 0.05 vs. 6 mM glucose (1-way ANOVA with Dunnett’s post-hoc test). (C) Effects of 10 pM GLP-1 on electrical activity in Tpc1 Tpc2 DKO β cells. Note that GLP-1 stimulates electrical activity in Tpc1 Tpc2 DKO β cells (n = 4). (DF) Change in fluo-3 fluorescence (ΔF/F0) measured in single cells in small islet cell clusters from NMRI mice. Diazoxide (200 μM), GLP-1 (1 pM), [K+]o (50 mM), and thapsigargin (1 μM) were applied as indicated by horizontal lines. Representative traces of 7 to 12 cells from 3 to 7 experiments. (G) Failure of GLP-1 to evoke electrical activity in the presence of diazoxide (200 μM). Glucose was present at a concentration of 6 mM throughout. Note spontaneous action potential firing at 6 mM glucose, suppression of action potential firing, and membrane repolarization evoked by application of diazoxide and small and reversible depolarization produced by GLP-1 (n = 6 from 4 mice).
Figure 9
Figure 9. GLP-1 acts by a TRPM4- and TRPM5-dependent mechanism.
(AC) Effects of 10 pM GLP-1 on insulin secretion in islets from (A) wild-type, (B) Trpm4–/–, and (C) Trpm5–/– mice exposed to 6 mM glucose. *P < 0.05 vs. 6 mM glucose (n = 6 islets from 7–9 mice; 1-way ANOVA with Dunnett’s post-hoc test). (DF) Effects of GLP-1 (1 pM to 10 nM) on electrical activity in (D) wild-type (n = 5 cells from 2 mice), (E) Trpm4–/– (n = 9 cells from 5 mice), and (F) Trpm5–/– (n = 7 cells from 5 mice) β cells isolated from C57BL6/N mice. (G) Histogram summarizing action potential frequency in β cells exposed to 6 mM glucose in the absence or presence of GLP-1 glucose in wild-type, Trpm4–/–, and Trpm5–/– β cells as in DF. *P < 0.05 vs. 6 mM glucose (Student’s t test); P < 0.05 vs. 6 mM glucose plus GLP-1 (wild-type; 1-way ANOVA with Dunnett’s post-hoc test).
Figure 8
Figure 8. GLP-1 stimulates electrical activity by activation of a Na+-dependent and KATP channel–independent mechanism.
(A and B) Membrane potential recording from (A) mouse (n = 6 cells from 2 mice) and (B) human (n = 4 cells from 3 donors) β cells. Tolbutamide and GLP-1 were added as indicated above traces. Electrical activity in the presence of glucose and tolbutamide was suppressed by injection of hyperpolarizing current (–1.5 pA in A and –9 pA in B as indicated) in the different experiments. For clarity, the recordings have been color coded (gray, 6 mM glucose; black, after addition of tolbutamide; blue, after injection of hyperpolarizing current; red, after application of GLP-1). (C) GLP-1 remains capable of depolarizing mouse β cells in the presence of the L-type Ca2+ channel blocker isradipine but does not evoke action potential firing (n = 6 from 3 mice). The depolarizing action of GLP-1 was reversibly suppressed by lowering [Na+]o to 28 mM (“20% Na”) (n = 3 from 2 mice).
Figure 7
Figure 7. Physiological concentrations of GLP-1 activate a depolarizing membrane current in β cells.
(A) Whole-cell resting currents activated by application of ±10 mV voltage pulses from a holding potential of –70 mV. Measurements were made at 6 mM glucose alone (black trace) and 10 minutes after addition of 1 pM GLP-1 (red trace). (B) Summary of effects of 1 pM GLP-1 on resting membrane conductance (G) calculated from the experiments in A. Note that GLP-1 is without a detectable inhibitory effect (n = 4 cells from 4 mice). (C) As in A but testing responses at 6 mM glucose alone (black trace) after addition of 100 μM tolbutamide (gray trace) and following addition of GLP-1 in the continued presence of glucose and tolbutamide (red trace). (D) Summary of effects of tolbutamide and GLP-1 on membrane conductance (G) calculated from the current excursions in response to voltage pulses (C) and expressed as a percentage of that at 6 mM glucose. *P < 0.05 vs. 6 mM glucose; P < 0.05 vs. 6 glucose plus tolbutamide (n = 5 from 4 mice; 1-way ANOVA with Dunnett’s post-hoc test). (E) Membrane current at –70 mV recorded in the presence of 6 mM glucose before and after addition of 1 pM GLP-1 and effect of lowering [Na+]o from 140 mM to 28 mM (“20% Na+”). (F) As in E but showing effects of lowering [Na+]o in the presence of 6 mM glucose alone. (G) Histogram summarizing effects of lowering [Na+]o on the current at –70 mV (ΔI) in the presence of 6 mM glucose alone (n = 8 cells from 4 mice) or in the presence of 6 mM glucose and 1 pM GLP-1 (n = 6 cells from 4 mice). *P < 0.01 vs. normal [Na+]o (Student’s t test) All measurements in this figure were performed using the perforated patch whole-cell technique.
Figure 6
Figure 6. PKA-independent stimulation of β cell electrical activity.
(A) Representative membrane potential recording from a single β cell pretreated with 100 μM Rp-8-Br-cAMPS (n = 4 cells from 2 mice) or myr-PKI (n = 4 cells from 2 mice, not shown). Note initiation of electrical activity by GLP-1 in the presence of Rp-8-Br-cAMPS. (B) Effect of the PKC activator PMA on membrane potential (n = 5 cells from 4 mice). (C) Effect of the PLC inhibitor U73122 on action potential firing triggered by 1 pM GLP-1 (n = 8 cells from 6 mice). Note reversible inhibition. All measurements were performed using the perforated patch whole-cell technique in the presence of 6 mM glucose.
Figure 5
Figure 5. Activation of Gαq by GLP-1.
Dose-response curves of GLP-1 in yeast strains expressing GPA1/Gαq and GPA1/Gαs chimaeras. Activation of the reporter gene was calculated as a percentage of the maximum response observed (n = 7–8 experiments).
Figure 4
Figure 4. PKC-dependent effects of GLP-1.
(A) Representative blots of activated PKD1 and total PKD1 in mouse islets. p-PKD, phosphorylated PKD1. (B) Mean fold change in activated PKD1 relative to no stimulation control in response to GLP-1 in untreated or BIM-treated islets. The number of independent experiments (n) is indicated above the each bar. Mean ± SEM (where n > 2) or mean ± range (n = 2). *P = 0.01 vs. unstimulated; P < 0.05 vs. 1 nM GLP-1 alone; P < 0.05 vs. ACh alone (1-way ANOVA with Dunnett’s post-hoc test). (C) The effect of GLP-1 on [DAG]i measured in single cells from dispersed pancreatic islets. Characteristic responses to 1 pM and 10 nM GLP-1 as well as 1 μM ACh (added as indicated above the trace, n = 9). (D) Comparison of the effect of 1 and 10 pM GLP-1 on [DAG]i (n = 30 cells from 2 mice). All values are statistically higher than baseline (P < 0.05), apart from 10 nM GLP-1. *P < 0.05 vs. 1 pM GLP-1; P < 0.05 vs. baseline (Friedman ANOVA with Dunn-Bonferroni post-hoc test). (E and F) Effects of 1 pM GLP-1 on insulin secretion in the absence and presence of the membrane-permeable PKC inhibitors (BIM, n = 9; calphostin C, n = 4) (100 nM; introduced during 30-minute preincubation). *P < 0.05 vs. 1 mM glucose, P < 0.05 vs. 6 mM glucose, P < 0.05 vs. 6 mM glucose plus 1 pM GLP-1 (1-way ANOVA with Dunnett’s post-hoc test).
Figure 3
Figure 3. PKA-independent effects of GLP-1.
(A) Effects of glucose and 1 pM GLP-1 on insulin secretion in mouse islets in the absence and presence of the membrane-permeable PKA inhibitor myr-PKI (1 μM; introduced during 30-minute preincubation). P < 0.05 vs. 1 mM glucose; *P < 0.01 vs. 6 mM glucose; P < 0.01 vs. 6 mM glucose plus 1 pM GLP-1; §P < 0.01 vs. 6 mM glucose and 1 μM myr-PKI (n = 8 experiments; 1-way ANOVA with Dunnett’s post-hoc test). (B) As in A but using human islets (n = 6–7 from 3 donors, not the same as in Figure 1G) and using Rp-8-Br-cAMPS to inhibit PKA. (C) Changes in [cAMP]i concentration in response to increasing concentrations of GLP-1 (indicated above the traces) measured using recombinant cAMP sensor Epac2-camps in 2 representative cells (continuous and dotted lines). The CFP/YFP ratio R has been normalized to its initial value R0. (D) Relationship between GLP-1 concentration and elevation of [cAMP]i (n = 33 cells from 4 mice). The dose-response curve was fit to a Hill equation (Equation 2). (E) PKA activity measured in single cells from PKI-pretreated (n = 22, white squares) and control (n = 24, black squares) cells. GLP-1, 3-isobutyl-1-methylxanthine (IBMX) and forskolin were added as indicated. (F) Basal YFP/CFP ratio in control (n = 67) and PKI-pretreated (n = 65, 1 hour, 10 μM) islet cells. *P < 0.05 (Mann-Whitney nonpaired test).
Figure 2
Figure 2. Stimulatory effects of low concentrations of GLP-1 depend on L-type Ca2+ channels.
(A) GLP-1 (1 pM) enhances mouse β cell Ca2+ currents (ICa) evoked by 20-ms depolarization from –70 mV to 0 mV (n = 7 cells from 5 mice). (B) Current-voltage (I-V) relationships of whole-cell Ca2+ currents in the absence (black) and presence (red) of GLP-1. Current amplitudes have been normalized to cell capacitance. Ca2+ current activation curves are shown in the inset in the absence and presence of GLP-1. *P < 0.05 vs. control by paired Student’s t test (n = 5 cells from 3 mice). (C) GLP-1 inhibits ICa when added in the presence of isradipine (added 5 minutes prior to the addition of GLP-1) (n = 5 cells from 3 mice). (D) Effects of GLP-1 on insulin secretion in mouse islets in the absence and presence of GLP-1 and/or isradipine. Isradipine was included during the 30-minute preincubation. *P < 0.05 vs. 1 mM glucose; P < 0.05 vs. 6 mM glucose; P < 0.01 vs. 6 mM glucose plus GLP-1 (n = 7–8; 1-way ANOVA with Dunnett’s post-hoc test). (E and F) As in A and C but using human β cells (n = 13 cells from 6 donors in E; n = 6 cells from 3 donors in F). Rectangles indicate the period used for measuring charge entry (QCa) to avoid contribution of voltage-gated Na+ current (initial spiky component). (G) Exocytosis measured as an increase in membrane capacitance evoked by 500-ms depolarizations from –70 mV to 0 mV under control conditions (6 mM glucose, black) and 10 minutes after addition of GLP-1 (red). A control experiment showing that when GLP-1 was not added, the exocytotic responses remained small and stable for 10 minutes (blue; n = 5), is also shown. (H) Exocytosis elicited by a train of three 500-ms depolarizations from –70 mV to 0 mV in a human β cell before (black) and 10 minutes after (red) the addition of GLP-1 (representative of 5 cells from 3 donors).
Figure 1
Figure 1. Stimulatory effects of picomolar concentrations of GLP-1 on insulin secretion, electrical activity, and [Ca2+]i.
(A) Insulin secretion measured at 6 mM glucose (black circle) and increasing concentrations of GLP-1 (n = 4–8 experiments). The white circle shows insulin secretion measured at 1 mM glucose in the absence of GLP-1. P<0.05 vs. 1 mM glucose, *P < 0.05 vs. 6 mM glucose (1-way ANOVA with Dunnett’s post-hoc test). (B) Insulin secretion at 1, 4, 6, and 10 mM glucose in the absence and presence of 1 pM GLP-1 (n = 9 experiments). *P < 0.01 vs. no GLP-1 (Student’s t test). (C) GLP-1 (1 pM) stimulated insulin secretion from perfused mouse pancreas (n = 4). (D) Membrane potential recording from a β cell exposed sequentially to 1 pM and 10 nM GLP-1 (representative of 24 of 25 cells). (E) Spontaneous [Ca2+]i oscillations in a β cell within an intact islet exposed to 1 pM GLP-1 (representative of 23 of 35 cells in 3 islets from 3 mice). (F) Insulin secretion in mouse islets at 6 mM glucose in the absence and presence of 1 pM GLP-1 and/or 100 nM exendin (9-39) (Ex9-39). *P < 0.05 vs. 1 mM glucose, P < 0.05 vs. 6 mM glucose (n = 3–5; 1-way ANOVA with Dunnett’s post-hoc test). (G) As in F but using human islets (n = 8–12 with islets from 2–4 donors). *P < 0.05 vs. 1 mM glucose, P < <0.05 vs. 6 mM glucose (n = 3–5; 1-way ANOVA with Dunnett’s post-hoc test).

Comment in

Similar articles

Cited by

References

    1. Danaei G, et al. National, regional, and global trends in fasting plasma glucose and diabetes prevalence since 1980: systematic analysis of health examination surveys and epidemiological studies with 370 country-years and 2.7 million participants. Lancet. 2011;378(9785):31–40. doi: 10.1016/S0140-6736(11)60679-X. - DOI - PubMed
    1. Weir GC, Bonner-Weir S. Islet β cell mass in diabetes and how it relates to function, birth, and death. Ann N Y Acad Sci. 2013;1281:92–105. doi: 10.1111/nyas.12031. - DOI - PMC - PubMed
    1. Deacon CF, Holst JJ. Dipeptidyl peptidase-4 inhibitors for the treatment of type 2 diabetes: comparison, efficacy and safety. Expert Opin Pharmacother. 2013;14(15):2047–2058. doi: 10.1517/14656566.2013.824966. - DOI - PubMed
    1. Ussher JR, Drucker DJ. Cardiovascular actions of incretin-based therapies. Circ Res. 2014;114(11):1788–1803. doi: 10.1161/CIRCRESAHA.114.301958. - DOI - PubMed
    1. Balas B, et al. The dipeptidyl peptidase IV inhibitor vildagliptin suppresses endogenous glucose production and enhances islet function after single-dose administration in type 2 diabetic patients. J Clin Endocrinol Metab. 2007;92(4):1249–1255. doi: 10.1210/jc.2006-1882. - DOI - PubMed

Publication types

MeSH terms