. 2015;11(12):2213-32.
doi: 10.1080/15548627.2015.1108507.

MIR517C inhibits autophagy and the epithelial-to-mesenchymal (-like) transition phenotype in human glioblastoma through KPNA2-dependent disruption of TP53 nuclear translocation

Affiliations

MIR517C inhibits autophagy and the epithelial-to-mesenchymal (-like) transition phenotype in human glioblastoma through KPNA2-dependent disruption of TP53 nuclear translocation

Yuntao Lu et al. Autophagy. 2015.

Erratum in

  • Corrigendum.
    [No authors listed] [No authors listed] Autophagy. 2016;12(2):445-8. doi: 10.1080/15548627.2016.1137171. Autophagy. 2016. PMID: 26902592 Free PMC article. No abstract available.
  • Correction.
    [No authors listed] [No authors listed] Autophagy. 2019 Jun;15(6):1125-1127. doi: 10.1080/15548627.2019.1599190. Epub 2019 Mar 28. Autophagy. 2019. PMID: 30920334 Free PMC article. No abstract available.

Abstract

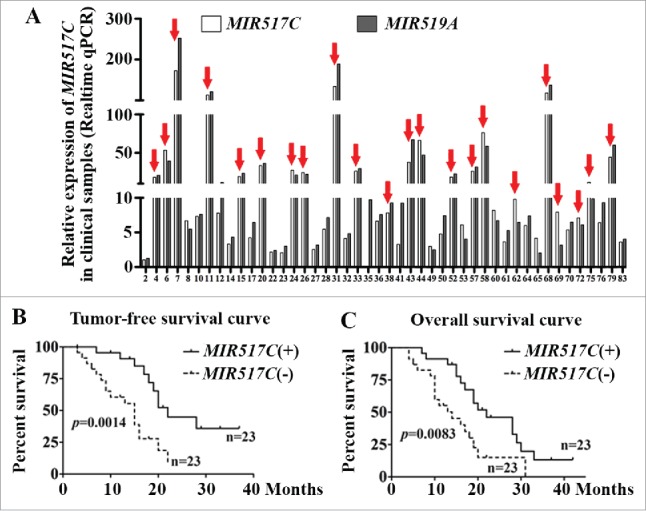
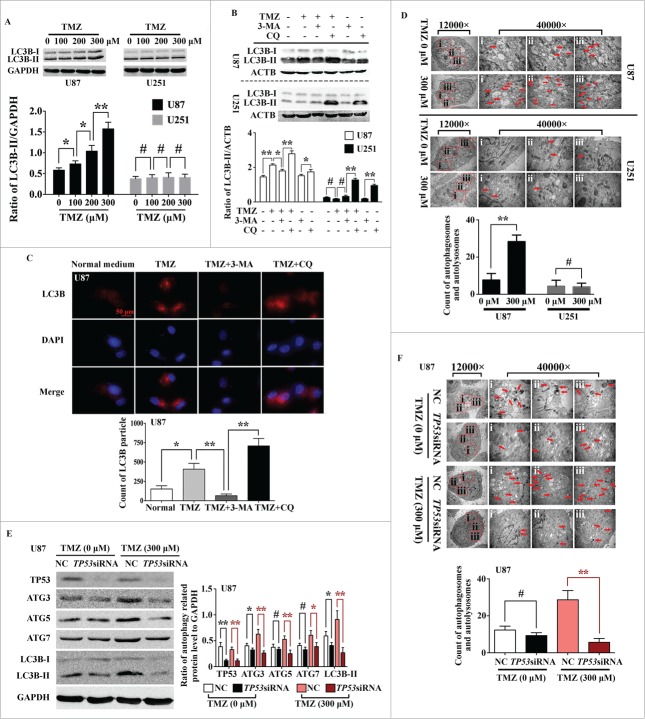
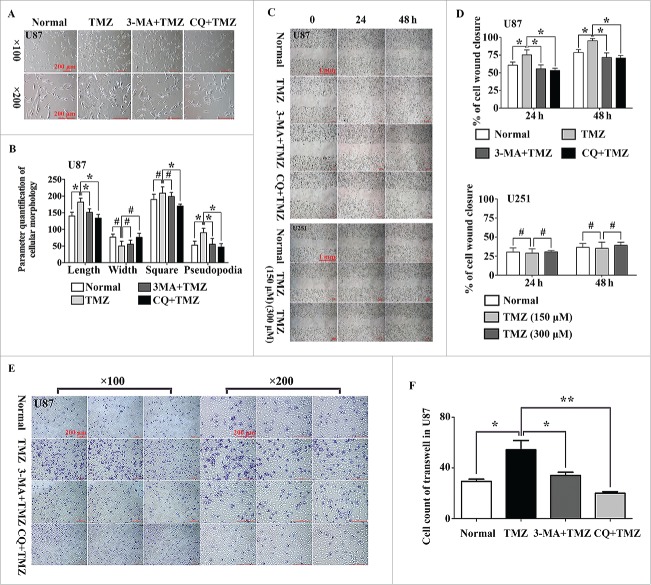
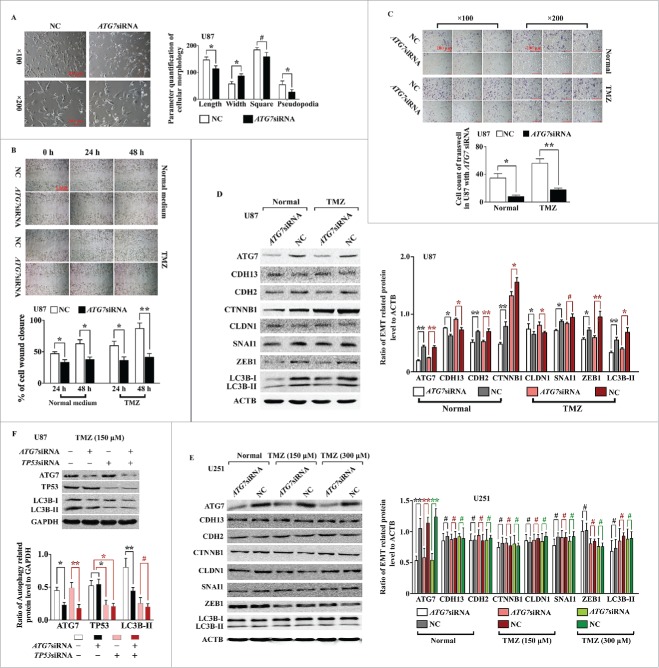
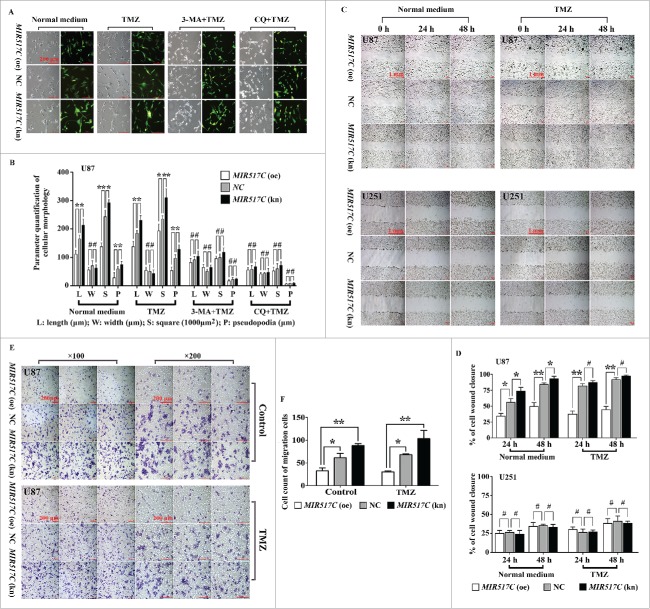
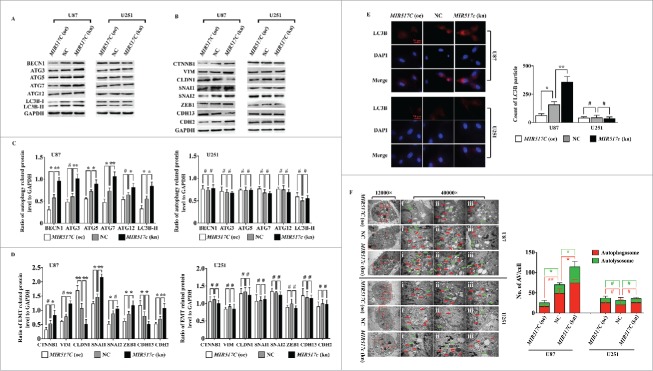
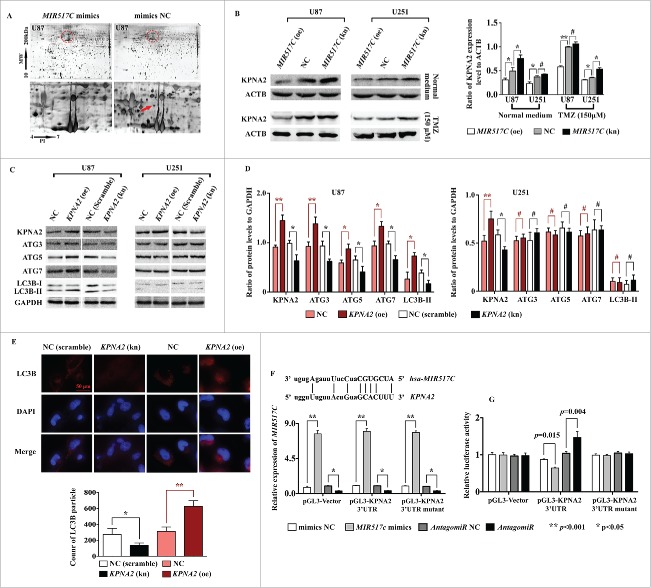
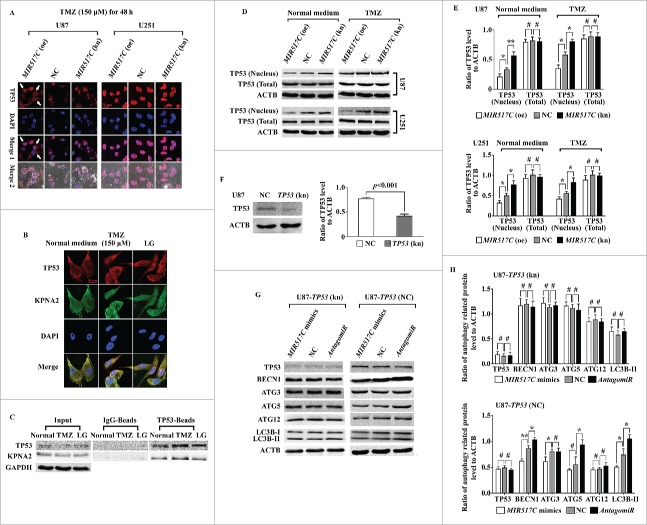
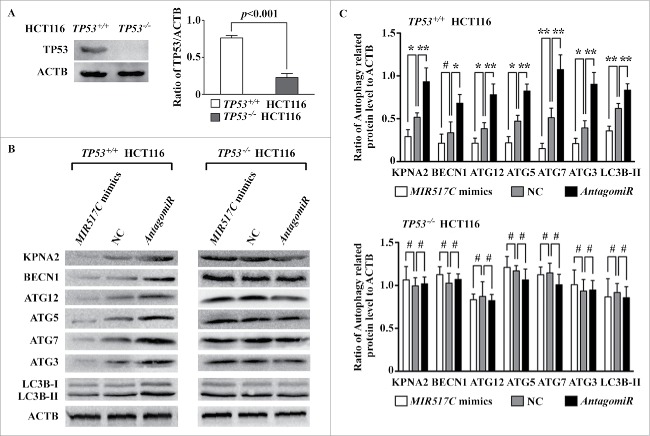
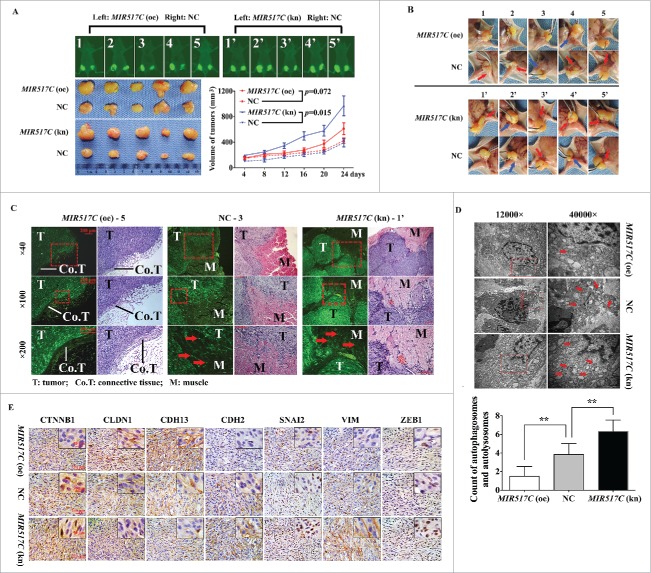
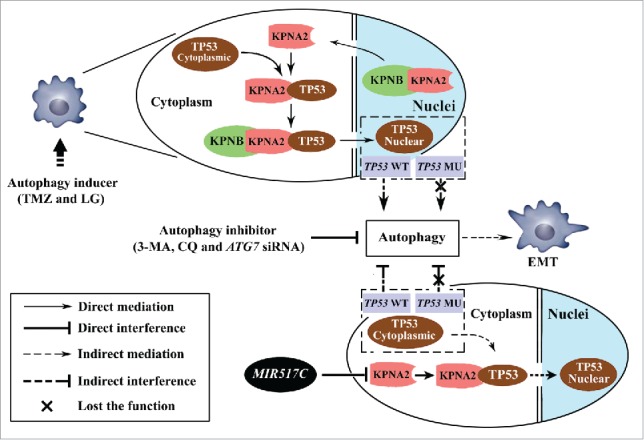
The epithelial-to-mesenchymal (-like) transition (EMT), a crucial embryonic development program, has been linked to the regulation of glioblastoma (GBM) progression and invasion. Here, we investigated the role of MIR517C/miR-517c, which belongs to the C19MC microRNA cluster identified in our preliminary studies, in the pathogenesis of GBM. We found that MIR517C was associated with improved prognosis in patients with GBM. Furthermore, following treatment with the autophagy inducer temozolomide (TMZ) and low glucose (LG), MIR517C degraded KPNA2 (karyopherin alpha 2 [RAG cohort 1, importin alpha 1]) and subsequently disturbed the nuclear translocation of TP53 in the GBM cell line U87 in vitro. Interestingly, this microRNA could inhibit autophagy and reduce cell migration and infiltration in U87 cells harboring wild-type (WT) TP53, but not in U251 cells harboring mutant (MU) TP53. Moreover, the expression of epithelial markers (i.e., CDH13/T-cadherin and CLDN1 [claudin 1]) increased, while the expression of mesenchymal markers (i.e., CDH2/N-cadherin, SNAI1/Snail, and VIM [vimentin]) decreased, indicating that the EMT status was blocked by MIR517C in U87 cells. Compared with MIR517C overexpression, MIR517C knockdown promoted infiltration of U87 cells to the surrounding structures in nude mice in vivo. The above phenotypic changes were also observed in TP53(+/+) and TP53(-/-) HCT116 colon cancer cells. In summary, our study provided support for a link between autophagy and EMT status in WT TP53 GBM cells and provided evidence for the signaling pathway (MIR517C-KPNA2-cytoplasmic TP53) involved in attenuating autophagy and eliminating the increased migration and invasion during the EMT.

Keywords: TP53; autophagy; epithelial-to-mesenchymal (-like) transition; glioblastoma; microRNA.


Figures

Figure 1.
Figure 1.
Low MIR517C expression was associated with poor prognosis in patients with GBM. (A) MIR517C and MIR519A expression levels in 46 GBM samples were detected by qRT-PCR (using the 2-ΔCT method); 23 cases (50%) exhibited high expression of these miRNAs, for which the expression was higher than the median (indicated by the red arrows; see also Tables S1 and S2). (B) Kaplan-Meier tumor-free survival analysis according to MIR517C levels. Patients with low expression of MIR517C, for which the expression was lower than the median (n = 23), had significantly poorer outcomes than those with high expression of MIR517C (P = 0.0014). (C) Kaplan-Meier overall survival analysis. The 23 patients with low MIR517C expression had significantly poorer outcomes than those with high MIR517C expression (P = 0.0083).
Figure 2.
Figure 2.
Induction of autophagy by TMZ depended on the phenotype of TP53. (A) Western blot analysis of LC3B-II in U87 and U251 cells after exposure to different concentrations of TMZ. The lower histogram shows densitometric analysis of western blot results (#, P > 0.05; *, P < 0.05; **, P < 0.001). (B) Effects of TMZ, 3-MA, and CQ on the conversion of LC3B-II in U87 and U251 cells. The lower histogram shows densitometric analysis of western blot results (#, P > 0.05; *, P < 0.05; **: P < 0.001). (C) Immunofluorescence analysis of LC3B in U87 cells after treatment with TMZ, 3-MA, and CQ. The LC3B particles were quantized by NIH ImageJ software (*, P < 0.05; **, P < 0.001). (D) Representative transmission electron microscope (TEM) images of U87 and U251 cells after exposure to 0 or 300 μM TMZ. Red arrows indicate formation of autophagic vacuoles. (E) Expression of autophagy-related proteins in U87 cells treated with TMZ and TP53 siRNA. The histogram shows densitometric analysis of western blot results (#, P > 0.05; *, P < 0.05; **, P < 0.001). (F) TEM images of U87 cells after exposure to TMZ and TP53 siRNA. Red arrows indicate formation of autophagic vacuoles.
Figure 3.
Figure 3.
Induction of autophagy increased cell migration and infiltration in U87 cells harboring WT TP53, but not in the U251 cells harboring MU TP53. (A) Representative phase-contrast microscope images of U87 cells treated with normal medium, TMZ, TMZ plus 3-MA, and TMZ plus CQ. (B) The related parameters (length, width, and area of cells and length of pseudopodia) were measured by NIH ImageJ software (#, P > 0.05; *: P < 0.05). (C) Wounding healing assay of U87 cells (top) and U251 cells (bottom) in the presence or absence of autophagy inducers or inhibitors. (D) Quantification of the percentage of cell wound closure in U87 and U251 cells (#, P > 0.05; *: P < 0.05). (E) The infiltrative ability of U87 cells was measured following treatment with TMZ, TMZ plus 3-MA, or TMZ plus CQ. (F) The histogram represents the cell count of infiltrative cells in 6 high-resolution fields for 3 independent experiments. Error bars represent SDs (*, P < 0.05; **, P < 0.001).
Figure 4.
Figure 4.
ATG7 siRNA inhibited cell migration, infiltration, and the expression of EMT-related proteins in U87 cells but not in U251 cells. (A) Representative phase-contrast microscope images of U87 cells with ATG7 siRNA and NC, which were cultured in TMZ (150 μM) medium. The related parameters (length, width, and area of cells and length of pseudopodia) were measured by NIH ImageJ software. (B) Wounding healing assay of U87 cells with ATG7 siRNA and NC in normal medium (top) and in TMZ (bottom). Quantification of the percentage of cell wound closure in U87 and U251 cells (*, P < 0.05;, **: P < 0.001). (C) The infiltrative ability of U87 cells with ATG7 siRNA and NC was measured. The right histogram represents the cell count of infiltrative cells in 6 high-resolution fields for 3 independent experiments. Error bars represent SDs. (D) Western blotting was used to detect the expression of autophagy- and EMT-related proteins in U87 cells transiently transfected with ATG7 siRNA in normal medium or in the presence of TMZ. Densitometric analysis of the western blots shown in the right histogram (#, P > 0.05; *, P < 0.05; **, P < 0.001). (E) Western blotting was used to detect the expression of autophagy- and EMT-related proteins in U251 cells transiently transfected with ATG7 siRNA in normal medium or in the presence of TMZ (150 or 300 μM). Densitometric analysis of the western blots shown in the right histogram (#, P > 0.05; **, P < 0.001). (F) siRNAs targeting ATG7 and TP53 were cotransfected into U87 cells, and LC3B conversion was detected by western blotting. Densitometric analysis is shown in the right histogram (#, P > 0.05; *, P < 0.05; **, P < 0.001).
Figure 5.
Figure 5.
MIR517C regulated cell morphology, migration, and infiltration. (A) Representative phase-contrast microscope images of U87 cells cultured in normal medium or in the presence of 150 μM TMZ, TMZ plus 3MA, or TMZ plus CQ, following lentiviral-mediated overexpression (oe) or knockdown (kn) of MIR517C. All cells expressed GFP for detection of fluorescence. (B) The related cellular parameters (length, width, and area of cells and length of pseudopodia) were measured by NIH ImageJ software. (C) Wounding healing assays in U87 (top) and U251 (bottom) cells to compare cell migration between MIR517C (oe), NC, and MIR517C (kn). (D) Quantification of the percentage of cell wound closure (#, P > 0.05; *, P < 0.05; **, P < 0.001). (E) Transwell assays were used to evaluate cell infiltration capacity following overexpression (oe) or knockdown (kn) of MIR517C in U87 cells cultured in normal medium or in the presence of 150 μM TMZ. NC cells were used as a control. (F) Histogram representing the number of infiltrative cells in 6 high-resolution fields for 3 independent experiments. Error bars represent SDs.
Figure 6.
Figure 6.
MIR517C inhibited TMZ-induced autophagy and the EMT. (A) Western blot analysis was used to detect the expression of key autophagy-related proteins in U87 and U251 cells following overexpression (oe) or knockdown (kn) of MIR517C. NC cells were used as a control. (B) Levels of EMT-related proteins were detected by western blotting in U87 and U251 cells following overexpression (oe) or knockdown (kn). NC cells were used as a control. (C) Densitometric analysis of the western blots shown in (A). #, P > 0.05; *, P < 0.05; **, P < 0.001. (D) Densitometric analysis of the western blots shown in (B). #, P > 0.05; *, P < 0.05; **, P < 0.001. (E) Immunofluorescence analysis of LC3B expression in U87 and U251 cells following overexpression (oe) or knockdown (kn) of MIR517C. LC3B particle data were subjected to statistical analysis (#, P > 0.05; *, P < 0.05; **, P < 0.001). (F) Representative transmission electron microscope images of U87 and U251 cells following overexpression (oe) or knockdown (kn) of MIR517C. NC cells were used as a control. Red arrows indicate formation of autophagosomes, and green arrows indicate autolysosomes.
Figure 7.
Figure 7.
MIR517C inhibited autophagy through targeting of KPNA2. (A) Two-dimensional electrophoresis analysis of U87 cells transfected with MIR517C mimics or NC. Distinct protein spots could be observed (red dotted area, red arrow). The target spot was confirmed as KPNA2 by mass spectrometry analysis. (B) Western blotting confirmed the expression of KPNA2 protein in U87 and U251 cells following overexpression (oe) or knockdown (kn) of MIR517C. NC cells were used as a control. The right histogram shows densitometric analysis (#, P > 0.05; *, P < 0.05; **, P < 0.001). (C) U87 and U251 cells exhibiting KPNA2 overexpression or knockdown were established, and autophagy-related protein levels were measured by western blotting. (D) Densitometric analysis of the western blots shown in (C). #, P > 0.05; *, P < 0.05; **, P < 0.001. (E) Immunofluorescence analysis of LC3B expression in U87 cells following overexpression or knockdown of KPNA2. LC3B particle data were subjected to statistical analysis (*, P < 0.05; **, P < 0.001). (F) Sequence matching between MIR517C and the 3′-UTR of KPNA2 is shown. U87 cells were transfected with MIR517C mimic, a mimic control (NC), AntagomiR, or nontargeting AntagomiR (AntagomiR NC). The level of MIR517C was assayed by Taq Man qRT-PCR. (G) Luciferase assays in U87 cells cotransfected with pGL3-control reporter constructs containing the KPNA2 3′-UTR MIR517C-binding site (pGL3-KPNA2-UTR) or a mutated binding site (pGL3-KPNA2-UTRmt) and MIR517C mimic, mimic control, AntagomiR, or nontargeting AntagomiR for 72 h. Samples were run in triplicate, and 3 independent experiments were performed.
Figure 8.
Figure 8.
MIR517C inhibited autophagy by interfering with the nucleocytoplasmic transport of TP53 through KPNA2 in U87 cells. (A) Representative confocal immunofluorescence images of TP53 in U87 and U251 cells following overexpression (oe) or knockdown (kn) of MIR517C. NC cells were used as a control. (B) Immunofluorescence analysis was used to determine the colocalization of KPNA2 and TP53. (C) CoIP assays were used to detect interactions between KPNA2 and TP53. (D) Cells exhibiting stable knockdown of TP53 were established, and TP53 protein levels were analyzed by western blotting. (E) Densitometric analysis of the western blots shown in (D) (#, P > 0.05; *, P < 0.05; **, P < 0.001). (F) Cells exhibiting stable knockdown of TP53 were established, and the expression level of TP53 was detected by western blot. (G) MIR517C mimics, NC, and AntagomiR were transfected into TP53(kn) cells, and the expression levels of autophagy-related proteins were detected by western blotting and densitometric analysis. (H) Densitometric analysis of the western blots shown in (G). #, P > 0.05.
Figure 9.
Figure 9.
Validation of the role of MIR517C and KPNA2 in inhibition of autophagy in TP53+/+ and TP53-/- HCT116 colon cancer cells. (A) Western blotting was used to measure TP53 protein levels in TP53+/+ and TP53-/- HCT116 cells. The histogram on the right shows the results of densitometric analysis. (B) MIR517C mimics, NC, or siRNA were transfected into colon cancer cells, and the expression levels of KPNA2 and autophagy-related proteins were detected by western blotting. (C) Densitometric analysis of the western blots shown in (B). #, P > 0.05; *, P < 0.05; **, P < 0.001.
Figure 10.
Figure 10.
Inhibition of autophagy and the EMT by MIR517C in a mouse model. (A) MIR517C (oe), NC, and MIR517C (kn) U87 cells were subcutaneously injected into the flanks of nude mice, with MIR517C (oe) and MIR517C (kn) U87 cells injected into the left side, and NC U87 cells injected into the right side. Tumor volumes were measured every 4 d for 24 d, and mice were then sacrificed. Fluorescence images of tumors are shown. (B) Tumors were dissected, and tumor invasion and infiltration was examined. The blue arrow indicates tumor invasion into the surrounding fascia and connective tissue, while the red arrow shows invasion into the surrounding muscle tissue. (C) Fluorescence microscope images and H&E staining of tumor samples. The red arrow shows invasion of the tumor cells with GFP expression into the muscle fibers. (D) Representative transmission electron microscope images of tumors derived from MIR517C (oe), NC, and MIR517C (kn) U87 cells. Red arrows indicate formation of autophagic vacuoles. (E) Immunohistochemical staining of EMT-related proteins in tumors derived from MIR517C (oe), NC, and MIR517C (kn) U87 cells. The higher-magnification images are shown at the upper-right corner of each image.
Figure 11.
Figure 11.
Schematic drawing of the MIR517C-KPNA2-cytoplasmic TP53 pathway. In TP53 wild-type GBM cells, autophagy inducers (TMZ and LG) stimulated autophagy dependent on the cytoplasmic-nuclear translocation of TP53 mediated by KPNA2. The EMT status of glioblastoma cells was altered to increase cell migration and invasion; this could be blocked by treatment with autophagy inhibitors, i.e., 3-MA and CQ, and by ATG7 siRNA. In contrast, MIR517C was able to directly target and degrade the KPNA2 protein and could interrupt the nuclear translocation of functional TP53 protein. As result of accumulation of cytoplasmic TP53, the autophagy induced by TMZ and LG was attenuated, eliminating the increases in migration and invasion observed during the EMT.

Similar articles

Cited by

References

    1. Stupp R, Mason WP, van den Bent MJ, Weller M, Fisher B, Taphoorn MJ, Belanger K, Brandes AA, Marosi C, Bogdahn U, et al.. Radiotherapy plus concomitant and adjuvant temozolomide for glioblastoma. N Engl J Med 2005; 352:987-96; PMID:15758009; http://dx.doi.org/10.1056/NEJMoa043330 - DOI - PubMed
    1. Brabletz T, Jung A, Reu S, Porzner M, Hlubek F, Kunz-Schughart LA, Knuechel R, Kirchner T. Variable beta-catenin expression in colorectal cancers indicates tumor progression driven by the tumor environment. Proc Natl Acad Sci U S A 2001; 98:10356-61; PMID:11526241; http://dx.doi.org/10.1073/pnas.171610498 - DOI - PMC - PubMed
    1. Brabletz T, Jung A, Spaderna S, Hlubek F, Kirchner T. Opinion: migrating cancer stem cells - an integrated concept of malignant tumour progression. Nat Rev Cancer 2005; 5:744-9; PMID:16148886; http://dx.doi.org/10.1038/nrc1694 - DOI - PubMed
    1. Kahlert UD, Nikkhah G, Maciaczyk J. Epithelial-to-mesenchymal(-like) transition as a relevant molecular event in malignant gliomas. Cancer Lett 2013; 331:131-8; PMID:23268331; http://dx.doi.org/10.1016/j.canlet.2012.12.010 - DOI - PubMed
    1. Azab AK, Hu J, Quang P, Azab F, Pitsillides C, Awwad R, Thompson B, Maiso P, Sun JD, Hart CP, et al.. Hypoxia promotes dissemination of multiple myeloma through acquisition of epithelial to mesenchymal transition-like features. Blood 2012; 119:5782-94; PMID:22394600; http://dx.doi.org/10.1182/blood-2011-09-380410 - DOI - PMC - PubMed

Publication types

MeSH terms