

Stable Chromosome Condensation Revealed by Chromosome Conformation Capture
- PMID: 26544940
- PMCID: PMC4639323
- DOI: 10.1016/j.cell.2015.10.026
Stable Chromosome Condensation Revealed by Chromosome Conformation Capture
Abstract
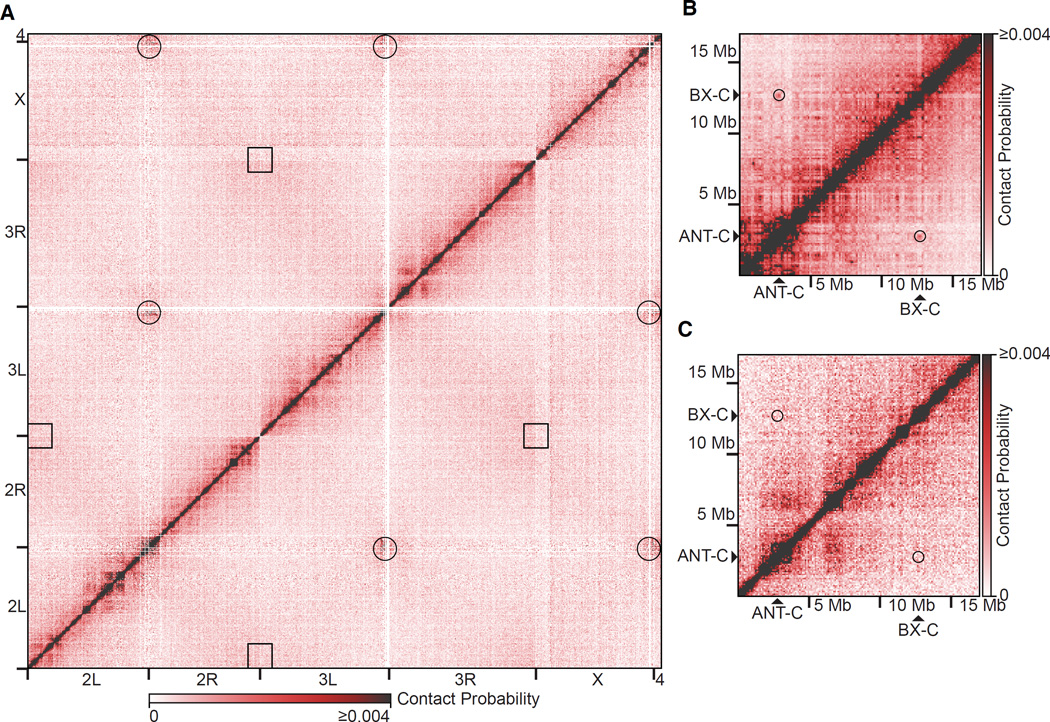
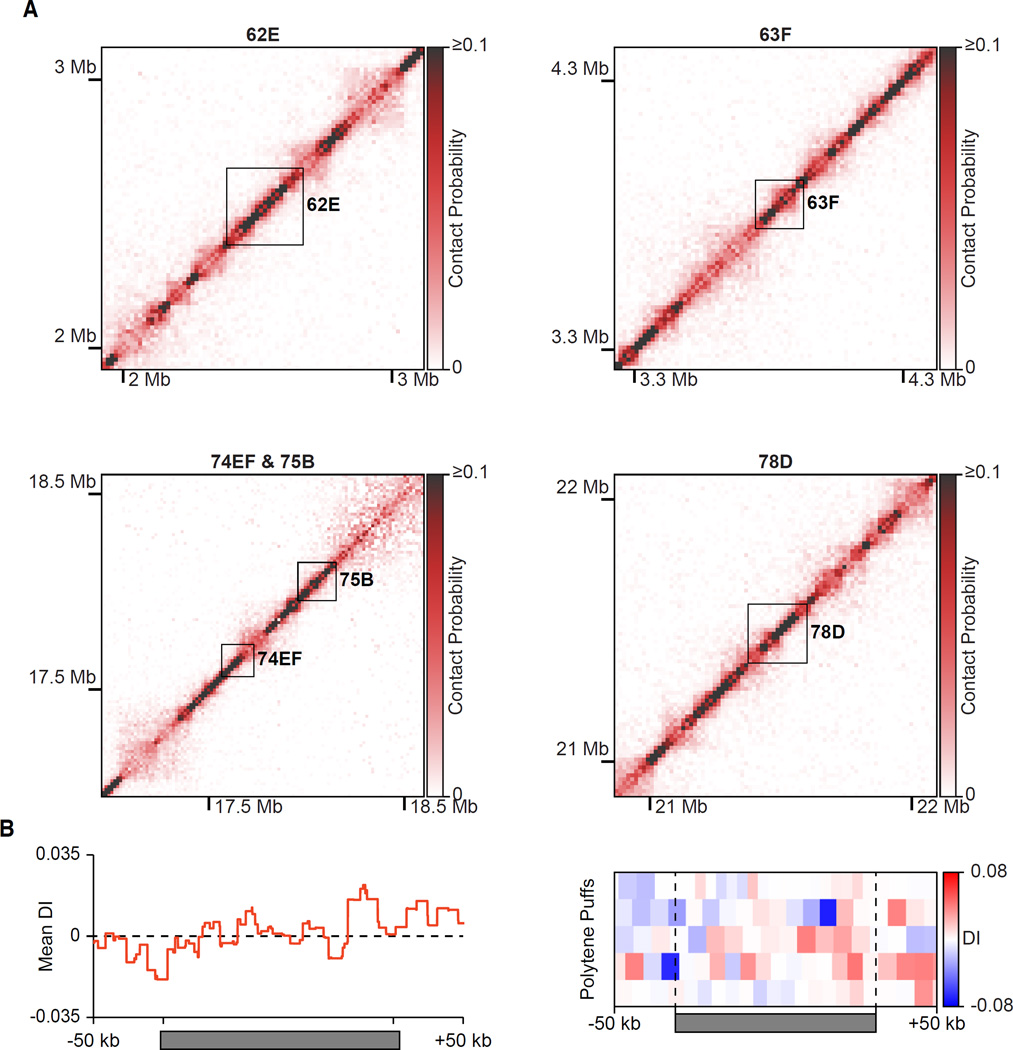
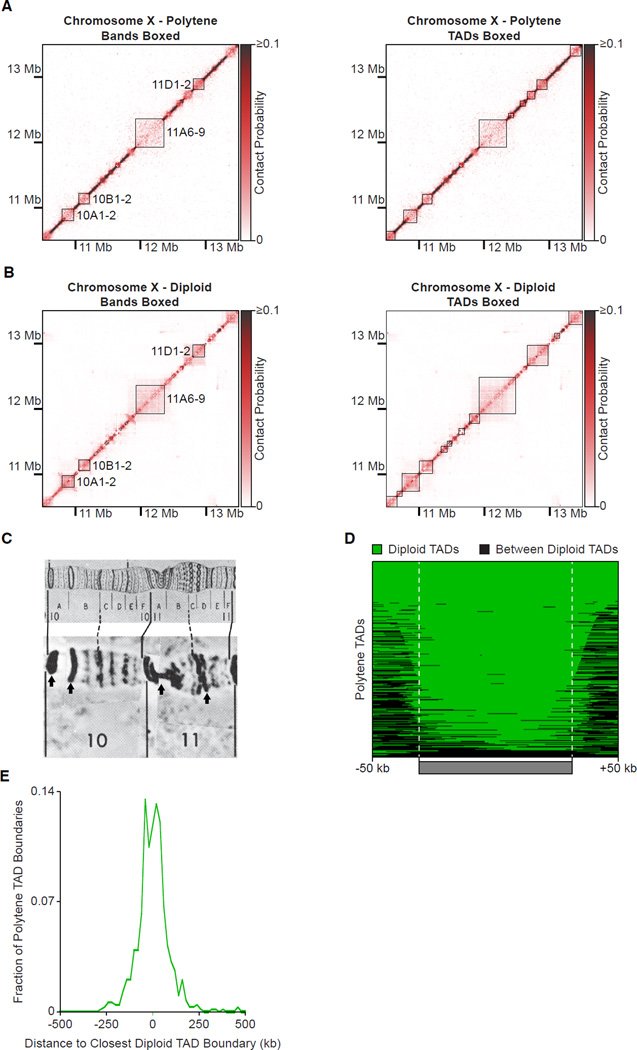
Chemical cross-linking and DNA sequencing have revealed regions of intra-chromosomal interaction, referred to as topologically associating domains (TADs), interspersed with regions of little or no interaction, in interphase nuclei. We find that TADs and the regions between them correspond with the bands and interbands of polytene chromosomes of Drosophila. We further establish the conservation of TADs between polytene and diploid cells of Drosophila. From direct measurements on light micrographs of polytene chromosomes, we then deduce the states of chromatin folding in the diploid cell nucleus. Two states of folding, fully extended fibers containing regulatory regions and promoters, and fibers condensed up to 10-fold containing coding regions of active genes, constitute the euchromatin of the nuclear interior. Chromatin fibers condensed up to 30-fold, containing coding regions of inactive genes, represent the heterochromatin of the nuclear periphery. A convergence of molecular analysis with direct observation thus reveals the architecture of interphase chromosomes.
Copyright © 2015 Elsevier Inc. All rights reserved.
Figures


Similar articles
-
Active chromatin and transcription play a key role in chromosome partitioning into topologically associating domains.Genome Res. 2016 Jan;26(1):70-84. doi: 10.1101/gr.196006.115. Epub 2015 Oct 30. Genome Res. 2016. PMID: 26518482 Free PMC article.
-
[Chromomeric organization of interphase chromosomes in Drosophila melanogaster].Tsitologiia. 2013;55(3):144-7. Tsitologiia. 2013. PMID: 23795454 Review. Russian.
-
[Identification and molecular genetic characterization of the polytene chromosome interbands in Drosophila melanogaster].Genetika. 2011 May;47(5):597-609. Genetika. 2011. PMID: 21786665 Russian.
-
Genes Containing Long Introns Occupy Series of Bands and Interbands In Drosophila melanogaster polytene Chromosomes.Genes (Basel). 2020 Apr 11;11(4):417. doi: 10.3390/genes11040417. Genes (Basel). 2020. PMID: 32290448 Free PMC article.
-
Banding Pattern of Polytene Chromosomes as a Representation of Universal Principles of Chromatin Organization into Topological Domains.Biochemistry (Mosc). 2018 Apr;83(4):338-349. doi: 10.1134/S0006297918040053. Biochemistry (Mosc). 2018. PMID: 29626921 Review.
Cited by
-
Fine-Scale Position Effects Shape the Distribution of Inversion Breakpoints in Drosophila melanogaster.Genome Biol Evol. 2020 Aug 1;12(8):1378-1391. doi: 10.1093/gbe/evaa103. Genome Biol Evol. 2020. PMID: 32437518 Free PMC article.
-
Chromatin: Moving a TAD closer to unravelling chromosome architecture.Nat Rev Genet. 2016 Jan;17(1):3. doi: 10.1038/nrg.2015.7. Epub 2015 Nov 16. Nat Rev Genet. 2016. PMID: 26567778 No abstract available.
-
Chromosome biology: Moving a TAD closer to unravelling chromosome architecture.Nat Rev Mol Cell Biol. 2015 Dec;16(12):701. doi: 10.1038/nrm4092. Nat Rev Mol Cell Biol. 2015. PMID: 26593955 No abstract available.
-
Unraveling the mechanisms of chromatin fibril packaging.Nucleus. 2016 May 3;7(3):319-24. doi: 10.1080/19491034.2016.1190896. Nucleus. 2016. PMID: 27249516 Free PMC article.
-
Biased visibility in Hi-C datasets marks dynamically regulated condensed and decondensed chromatin states genome-wide.BMC Genomics. 2020 Feb 22;21(1):175. doi: 10.1186/s12864-020-6580-6. BMC Genomics. 2020. PMID: 32087673 Free PMC article.
References
-
- Agard DA, Sedat JW. Three-dimensional architecture of a polytene nucleus. Nature. 1983;302:676–681. - PubMed
-
- Andreyenkov OV, Volkova EI, Demakov SA, Semeshin VF, Zhimulev IF. The decompact state of interchromomeric chromatin from the 3C6/C7 region of Drosophila melanogaster is determined by short DNA sequence. Dokl. Biochem. Biophys. 2010;431:57–59. - PubMed
-
- Ashburner M. Patterns of puffing activity in the salivary gland chromosomes of Drosophila. I. Autosomal puffing patterns in a laboratory stock of Drosophila melanogaster. Chromosoma. 1967;21:398–428. - PubMed
-
- Balbiani EG. Sur la structure du noyau des cellules salivaires chez les larves de Chironomus. Zoologischer Anzeiger iv. 1881:637–641.
-
- Beermann W. Chromomeres and genes. Results Probl Cell Differ. 1972;4:1–33. - PubMed
Publication types
MeSH terms
Associated data
- Actions
Grants and funding
LinkOut - more resources
Full Text Sources
Other Literature Sources
Molecular Biology Databases
