

On artifacts in single-molecule force spectroscopy
- PMID: 26540730
- PMCID: PMC4655570
- DOI: 10.1073/pnas.1519633112
On artifacts in single-molecule force spectroscopy
Abstract
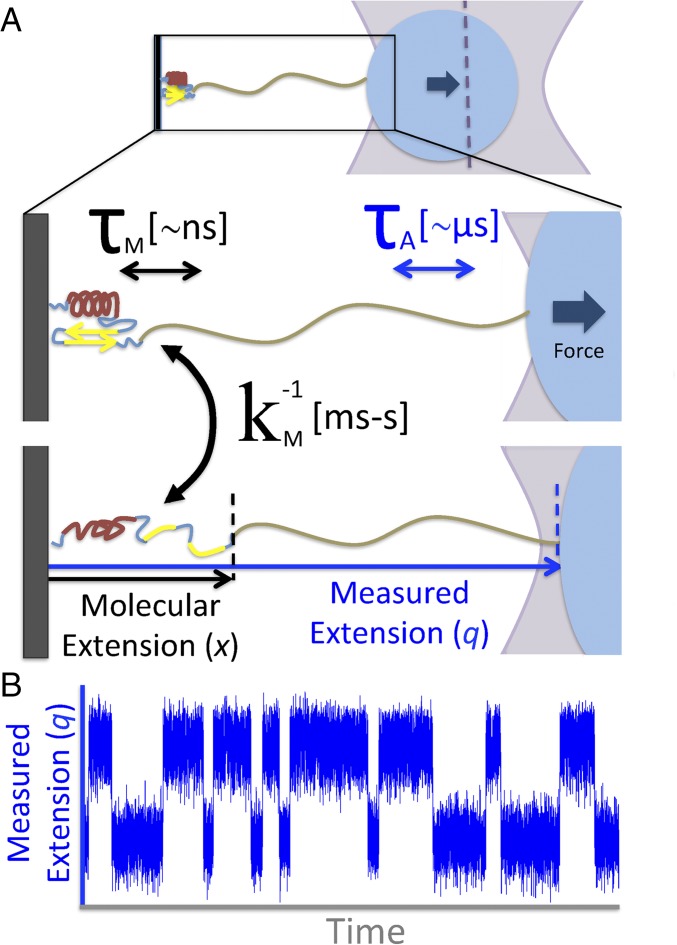
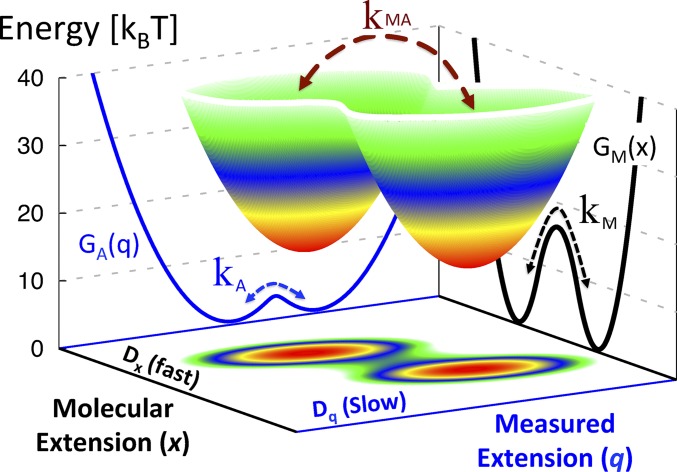
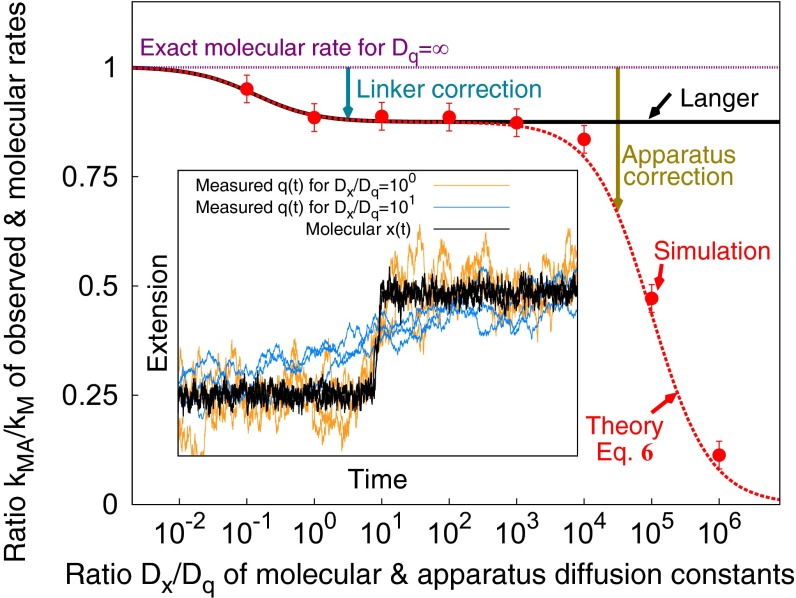
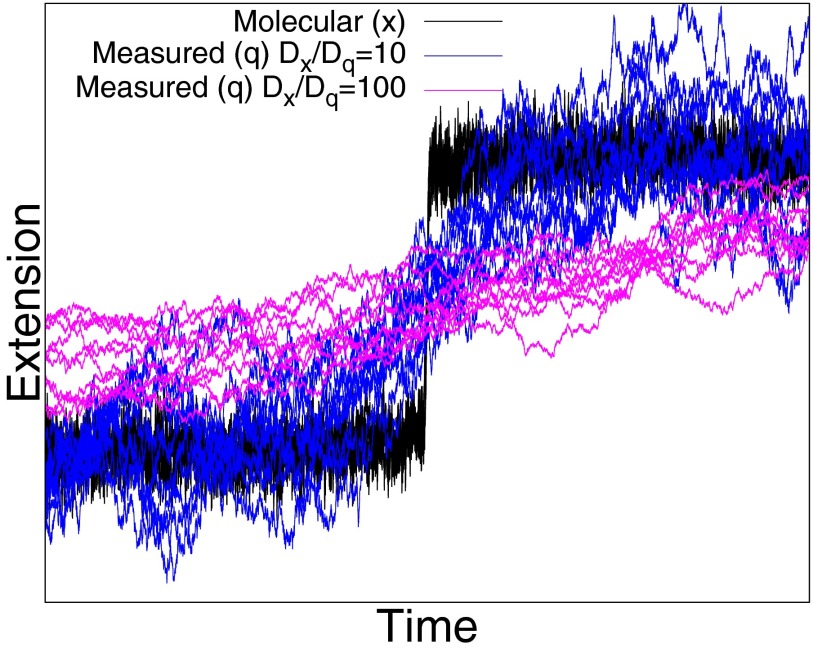
In typical force spectroscopy experiments, a small biomolecule is attached to a soft polymer linker that is pulled with a relatively large bead or cantilever. At constant force, the total extension stochastically changes between two (or more) values, indicating that the biomolecule undergoes transitions between two (or several) conformational states. In this paper, we consider the influence of the dynamics of the linker and mesoscopic pulling device on the force-dependent rate of the conformational transition extracted from the time dependence of the total extension, and the distribution of rupture forces in force-clamp and force-ramp experiments, respectively. For these different experiments, we derive analytic expressions for the observables that account for the mechanical response and dynamics of the pulling device and linker. Possible artifacts arise when the characteristic times of the pulling device and linker become comparable to, or slower than, the lifetimes of the metastable conformational states, and when the highly anharmonic regime of stretched linkers is probed at high forces. We also revisit the problem of relating force-clamp and force-ramp experiments, and identify a linker and loading rate-dependent correction to the rates extracted from the latter. The theory provides a framework for both the design and the quantitative analysis of force spectroscopy experiments by highlighting, and correcting for, factors that complicate their interpretation.
Keywords: anisotropic diffusion; free energy surface; pulling device; unfolding rate.
Conflict of interest statement
The authors declare no conflict of interest.
Figures

Similar articles
-
Transition paths in single-molecule force spectroscopy.J Chem Phys. 2018 Mar 28;148(12):123309. doi: 10.1063/1.5004767. J Chem Phys. 2018. PMID: 29604884 Free PMC article.
-
Influence of pulling handles and device stiffness in single-molecule force spectroscopy.Phys Chem Chem Phys. 2011 Feb 7;13(5):1836-42. doi: 10.1039/c0cp01528h. Epub 2010 Oct 11. Phys Chem Chem Phys. 2011. PMID: 20938520
-
Kinetic Ductility and Force-Spike Resistance of Proteins from Single-Molecule Force Spectroscopy.Biophys J. 2016 Aug 23;111(4):832-840. doi: 10.1016/j.bpj.2016.05.054. Biophys J. 2016. PMID: 27558726 Free PMC article.
-
The physics of pulling polyproteins: a review of single molecule force spectroscopy using the AFM to study protein unfolding.Rep Prog Phys. 2016 Jul;79(7):076601. doi: 10.1088/0034-4885/79/7/076601. Epub 2016 Jun 16. Rep Prog Phys. 2016. PMID: 27309041 Review.
-
Theoretical aspects of the biological catch bond.Acc Chem Res. 2009 Jun 16;42(6):693-703. doi: 10.1021/ar800202z. Acc Chem Res. 2009. PMID: 19331389 Review.
Cited by
-
Mechanical unfolding of spectrin reveals a super-exponential dependence of unfolding rate on force.Sci Rep. 2019 Jul 31;9(1):11101. doi: 10.1038/s41598-019-46525-w. Sci Rep. 2019. PMID: 31366931 Free PMC article.
-
Instrumental Effects in the Dynamics of an Ultrafast Folding Protein under Mechanical Force.J Phys Chem B. 2018 Dec 13;122(49):11147-11154. doi: 10.1021/acs.jpcb.8b05975. Epub 2018 Aug 21. J Phys Chem B. 2018. PMID: 30129367 Free PMC article.
-
Communication: Transition-path velocity as an experimental measure of barrier crossing dynamics.J Chem Phys. 2018 May 28;148(20):201102. doi: 10.1063/1.5030427. J Chem Phys. 2018. PMID: 29865813 Free PMC article.
-
Identical sequences, different behaviors: Protein diversity captured at the single-molecule level.Biophys J. 2024 Apr 2;123(7):814-823. doi: 10.1016/j.bpj.2024.02.020. Epub 2024 Feb 28. Biophys J. 2024. PMID: 38409780
-
Communication: Coordinate-dependent diffusivity from single molecule trajectories.J Chem Phys. 2017 Nov 28;147(20):201102. doi: 10.1063/1.5006456. J Chem Phys. 2017. PMID: 29195291 Free PMC article.
References
Publication types
MeSH terms
Grants and funding
LinkOut - more resources
Full Text Sources
Other Literature Sources
