

Subunit composition of VRAC channels determines substrate specificity and cellular resistance to Pt-based anti-cancer drugs
- PMID: 26530471
- PMCID: PMC4687416
- DOI: 10.15252/embj.201592409
Subunit composition of VRAC channels determines substrate specificity and cellular resistance to Pt-based anti-cancer drugs
Abstract
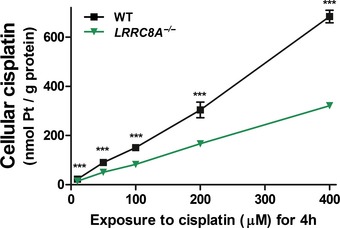
Although platinum-based drugs are widely used chemotherapeutics for cancer treatment, the determinants of tumor cell responsiveness remain poorly understood. We show that the loss of subunits LRRC8A and LRRC8D of the heteromeric LRRC8 volume-regulated anion channels (VRACs) increased resistance to clinically relevant cisplatin/carboplatin concentrations. Under isotonic conditions, about 50% of cisplatin uptake depended on LRRC8A and LRRC8D, but neither on LRRC8C nor on LRRC8E. Cell swelling strongly enhanced LRRC8-dependent cisplatin uptake, bolstering the notion that cisplatin enters cells through VRAC. LRRC8A disruption also suppressed drug-induced apoptosis independently from drug uptake, possibly by impairing VRAC-dependent apoptotic cell volume decrease. Hence, by mediating cisplatin uptake and facilitating apoptosis, VRAC plays a dual role in the cellular drug response. Incorporation of the LRRC8D subunit into VRAC substantially increased its permeability for cisplatin and the cellular osmolyte taurine, indicating that LRRC8 proteins form the channel pore. Our work suggests that LRRC8D-containing VRACs are crucial for cell volume regulation by an important organic osmolyte and may influence cisplatin/carboplatin responsiveness of tumors.
Keywords: VSOAC; VSOR; chloride channel; haploid cell screen; swelling‐activated.
© 2015 The Authors. Published under the terms of the CC BY NC ND 4.0 license.
Figures
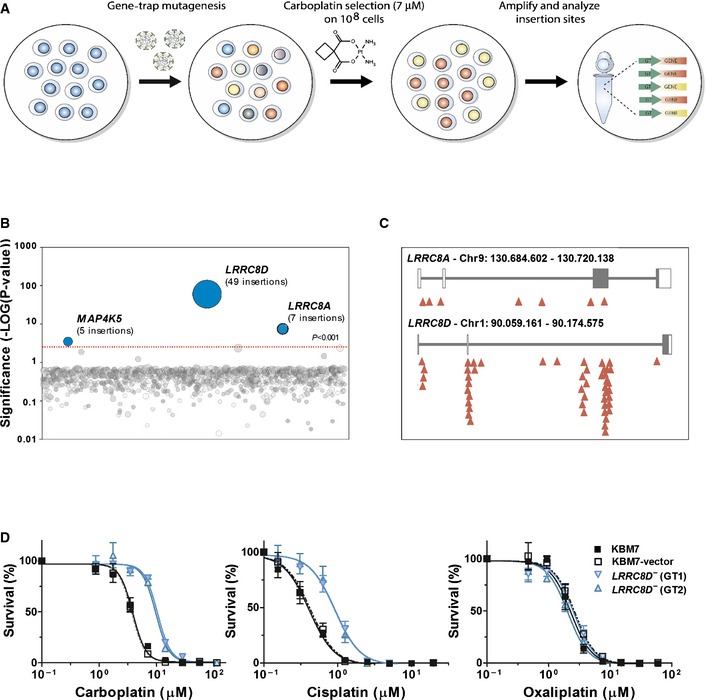
Outline of the loss‐of‐function screen.
Genes enriched for gene‐trap insertions in a carboplatin‐selected cell population compared to unselected control cells. Circles represent genes and their size corresponds to the number of independent insertions identified in the carboplatin‐selected population. Genes are ranked on the x‐axis based on chromosomal position.
Location of gene‐trap insertion sites (red arrowheads). White boxes indicate the 5′‐ and 3′‐untranslated regions, and the black boxes show the coding sequence in exons 3 and 4 (LRRC8A) and exon 3 (LRRC8D).
Loss of LRRC8D causes resistance to carboplatin and cisplatin, but not to oxaliplatin. Survival of parental, vector‐transduced, or LRRC8D‐deficient GT1 and GT2 KBM7 cells exposed for 96 h to increasing concentrations of cisplatin, carboplatin, and oxaliplatin. The corresponding IC50 values and 95% confidence interval (CI) are given in Appendix Table S2. Data are presented as mean ± SEM.
- A–C
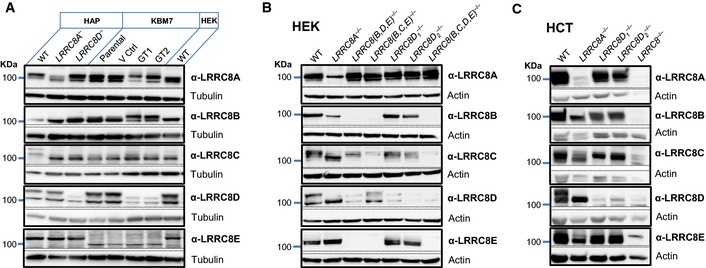
Western blot showing the expression of all
LRRC 8 subunits inHAP 1 andKBM 7 (A),HEK (B), andHCT 116 (C) cell lines, including knockout cell lines. Tubulin or actin was used as loading control. Note thatKBM 7 cells virtually lackLRRC 8E, explaining the lack of inactivation of their ICl,vol at clamped voltages (Fig 3B). Notice that disruption ofLRRC 8A changes the apparent sizes of the otherLRRC 8 subunits (prominently seen forLRRC 8D inHCT cells) becauseLRRC 8B through E needLRRC 8A to leave theER (Voss et al, 2014) and are therefore not fully glycosylated in its absence.LRRC 8D1 −/− andLRRC 8D2 −/− denote two independentHEK andHCT 116 knockout clones.
- A–C
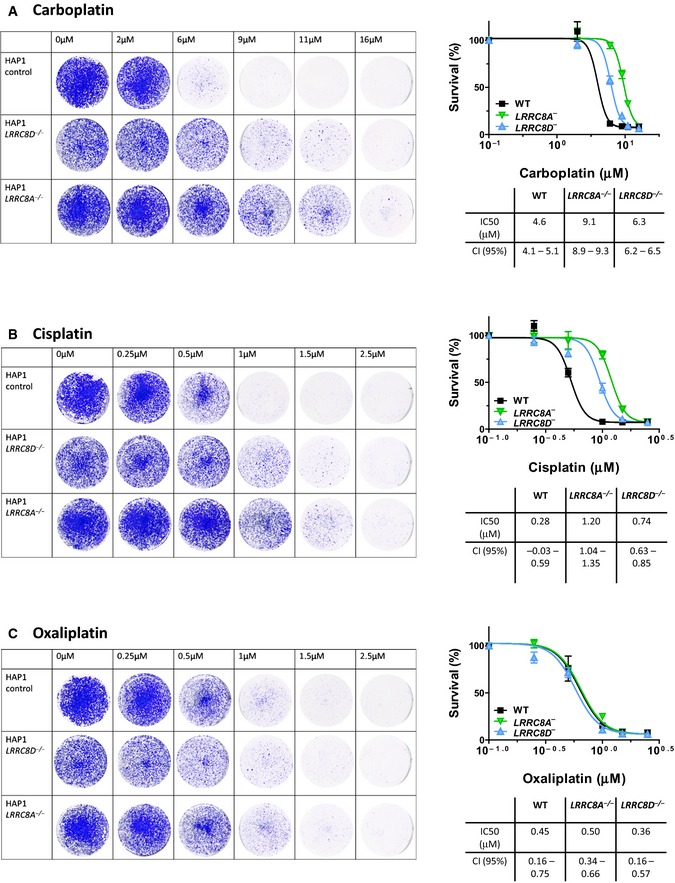
Clonogenic growth of
LRRC 8A − andLRRC 8D − orWT HAP 1 cells treated with carboplatin, cisplatin, or oxaliplatin. Cells were exposed to the indicated concentrations of carboplatin (A), cisplatin (B), or oxaliplatin (C) for 7 days. Surviving colonies were formalin‐fixed and stained with crystal violet. The optical absorption was determined at 590 nm after extracting the dye with 10% acetic acid. Data are presented as mean ±SEM (n = 6).CI , confidence interval.
- A–D
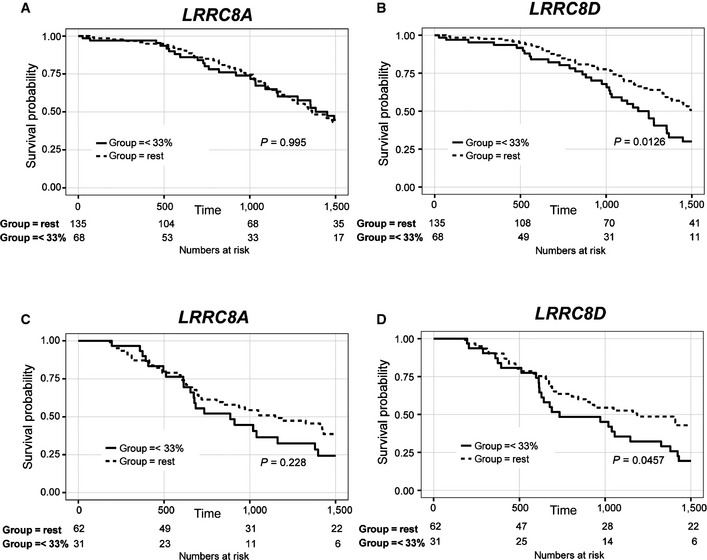
Differential survival based on LRRC8A (A, C) or LRRC8D (B, D) gene expression as extracted from the TCGA database (
http://cancergenome.nih.gov/ ) (A, B) or using the data from Patch et al (2015) (C, D). As cutoff the lower tertile of LRRC8A or LRRC8D gene expression was used. P‐values were determined using the log‐rank test.
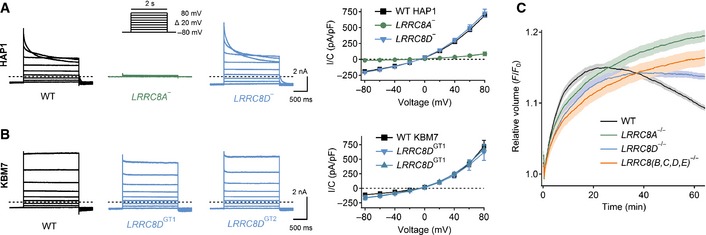
- A, B
VRAC currents (ICl,vol) of the HAP1 (A) and KBM7 (B) haploid cell lines. Left panels, example current traces of ICl,vol fully activated by hypotonic cell swelling measured with the voltage‐clamp protocol shown in (A). Dashed lines indicate zero current. Right panels, averaged current/voltage relationships of maximally activated ICl,vol. Consistent with VRAC currents, they needed hypotonic swelling for activation, displayed an I− > Cl− permeability sequence, and were blocked by DCPIB (Appendix Fig S2A–H). The difference in current inactivation between HAP1 and KBM7 cells can be explained by the fact that KBM7 cells hardly express LRRC8E (Fig EV1) which accelerates VRAC inactivation (Voss et al, 2014). At potentials > +100 mV, also KBM7 currents inactivated (Appendix Fig S2I). Data are presented as mean ± SEM; n = 5–10.
- C
Dependence of regulatory volume decrease (RVD) of HEK cells on LRRC8 genes. Cells were exposed to hypotonic medium starting at t = 0, and intracellular calcein fluorescence was followed over ˜1 h as semiquantitative measure of cell volume. Data are presented as mean values ± SEM from sixteen wells.
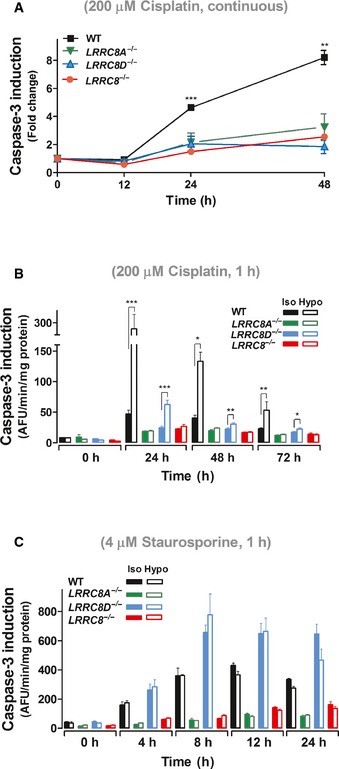
- A, B
Cisplatin‐induced caspase activity in the continuous presence of 200 μM cisplatin under isotonic conditions (A), or after 1 h exposure to 200 μM cisplatin under iso‐ and hypotonic conditions (B), was followed over time in WT, LRRC8A −/−, LRRC8D −/−, and LRRC8 −/− HCT116 cells. Results from LRRC8A −/− and LRRC8D −/− were obtained with two different clonal cell lines each and averaged.
- C
Caspase activation after 1‐h exposure to 4 μM staurosporine under iso‐ or hypotonic conditions of WT, LRRC8A −/−, LRRC8D −/−, and LRRC8 −/− HCT116 cells.
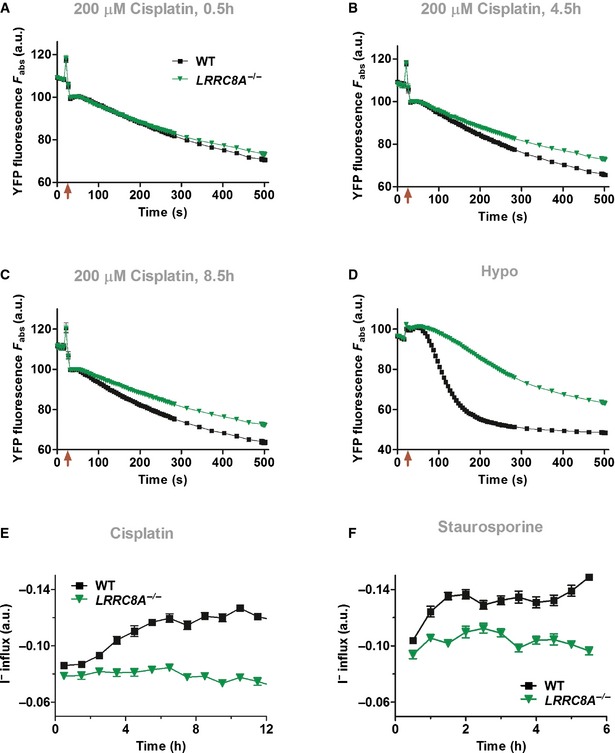
- A–C
Cisplatin‐induced iodide influx into WT (black ■), but not LRRC8A −/− (green ▼) HEK cells indicates VRAC halide current activation during apoptosis. Cells expressing an iodide‐sensitive YFP variant were exposed to 200 μM cisplatin for periods of 0.5 h (A), 4.5 h (B), or 8.5 h (C) before adding extracellular I− (50 mM final). The difference in slopes of YFP fluorescence quenching between control and cisplatin‐treated cells semiquantitatively reflects VRAC current activation. Note that increased YFP quenching with cisplatin preincubation is not due to large non‐specific leaks resulting from cell morbidity. Such leaks should lead to a fast component of YFP quenching in WT, but not LRRC8A −/− cells after the pipetting artifact that immediately follows addition of iodide (indicated by arrows).
- D
Swelling‐induced iodide influx into WT (black ■) and LRRC8A −/− (green ▼) HEK cells for comparison. Iodide (50 mM final) was added in isotonic or hypotonic (230 mOsm final) solution at the time indicated by arrow.
- E, F
Time course of VRAC activation by 200 μM cisplatin (E) or 4 μM staurosporine (F) determined as in (A–C). Averaged maximal slopes of YFP quenching from eight wells (E) or 16 wells (F) each were evaluated to estimate iodide influx rates. WT (black ■) and LRRC8A −/− (green ▼). Data are presented as mean ± SEM.
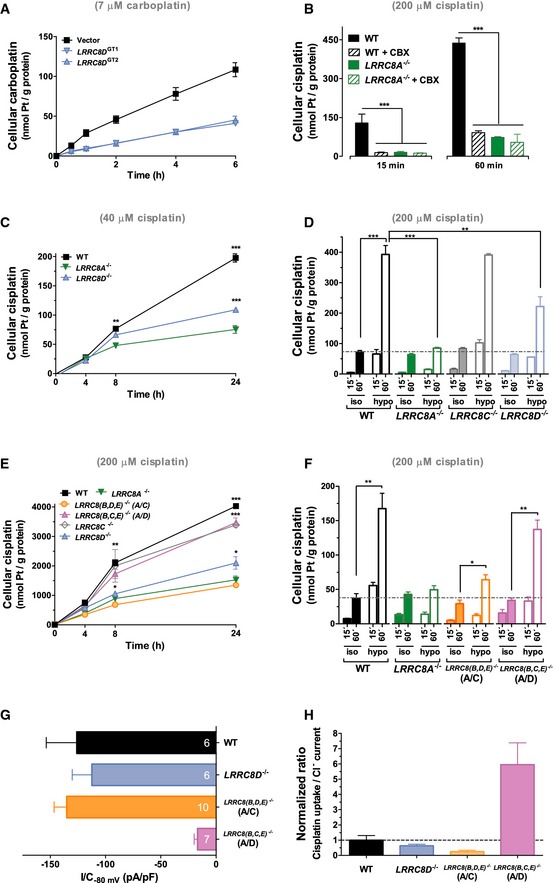
- A
Carboplatin uptake into control KBM7 cells and two LRRC8D‐deficient clones (n = 6).
- B
Hypotonicity‐stimulated cisplatin uptake in HEK WT cells was selectively blocked by 100 μM carbenoxolone (CBX), a non‐specific blocker of VRAC (n = 3).
- C, D
Cisplatin uptake into HEK cells of indicated genotypes using 40 μM cisplatin under long‐term isotonic (C) or 200 μM cisplatin in short‐term hypo‐ and isotonic (D) conditions as function of time (n = 3). Similar results were obtained in HCT116 cells (Fig EV4).
- E, F
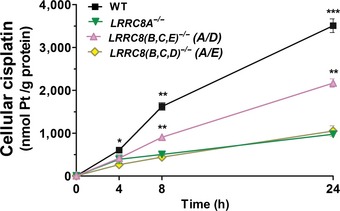
Cisplatin uptake (200 μM) into HEK cells of indicated genotypes. LRRC8(B,C,E) −/− and LRRC8(B,D,E) −/− cells express only LRRC8A and LRRC8D, and LRRC8A and LRRC8C, respectively (n = 3 for WT, 6 for LRRC8D −/−, 9 for LRRC8A −/− in E; n = 3 in F).
- G
Mean current densities of maximally activated ICl,vol at −80 mV. The number of cells is indicated for each column.
- H
Ratio of LRRC8‐dependent swelling‐activated cisplatin uptake (60 min) to mean ICl,vol (as in G) as function of genotype.
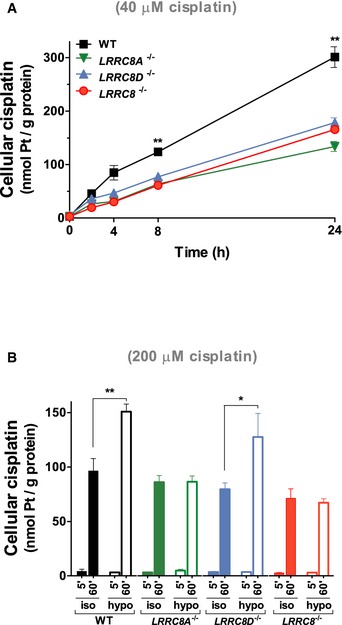
Long‐term cisplatin uptake into
WT ,LRRC 8A −/−,LRRC 8D −/−, andLRRC 8 −/−HCT 116 cells from isotonic culture medium containing 40 μM cisplatin.Comparison between short‐term uptake from isotonic and hypotonic saline containing 200 μM cisplatin into
WT ,LRRC 8A −/−,LRRC 8D −/−, andLRRC 8 −/−HCT 116 cells.
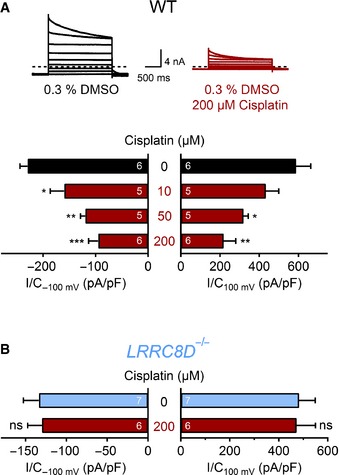
Upper panel, example current traces (as in Fig 3A) of fully activated ICl,vol in HEK cells exposed to hypotonic solution containing vehicle (0.3% DMSO) or 200 μM cisplatin in 0.3% DMSO. Dashed lines indicate zero current. Lower panel, ICl,vol current densities (at −100 mV and 100 mV) of WT HEK cells treated with different cisplatin concentrations.
No effect of 200 μM cisplatin/DMSO on ICl,vol in LRRC8D −/− HEK cells.
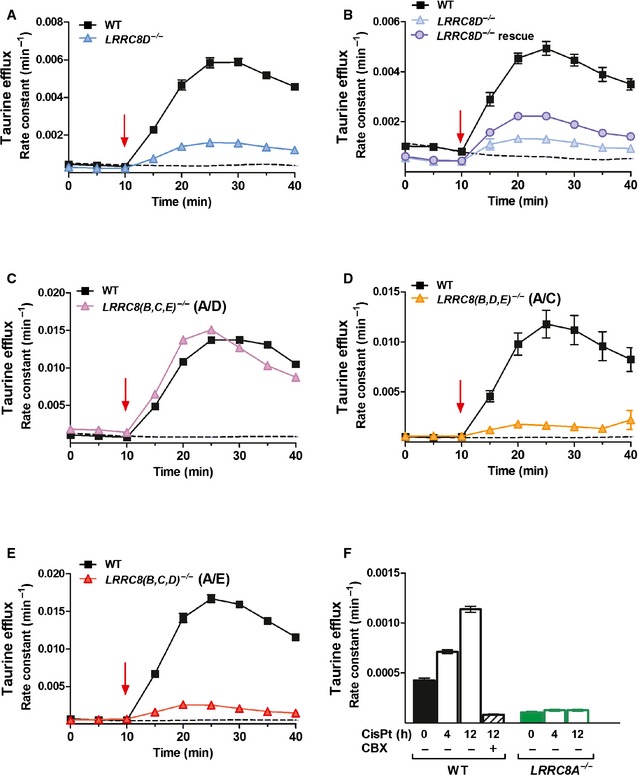
- A, B
Swelling‐induced efflux of 3[H]‐taurine from WT and LRRC8D −/− HEK cells (A, B) and partial rescue by transient transfection of LRRC8D (B). Rescue is incomplete due to low transfection/expression efficiency of LRRC8D (Voss et al, 2014).
- C–E
Swelling‐induced efflux of 3[H]‐taurine from LRRC8(B,C,E) −/− (C), LRRC8(B,D,E) −/− (D), or LRRC8(B,C,D) −/− (E) HEK cells compared to WT cells.
- F
Cisplatin‐induced taurine efflux (over 30 min) from WT and LRRC8A −/− HEK cells after preincubation with 200 μM cisplatin for 4 or 12 h, or without cisplatin (0 h). Carbenoxolone (CBX; 100 μM) blocks taurine efflux from WT cells treated for 12 h with cisplatin, excluding taurine flux through unspecific leaks.
Comment in
-
VRACs swallow platinum drugs.EMBO J. 2015 Dec 14;34(24):2985-7. doi: 10.15252/embj.201593357. Epub 2015 Nov 12. EMBO J. 2015. PMID: 26564094 Free PMC article.
Similar articles
-
Molecular composition and heterogeneity of the LRRC8-containing swelling-activated osmolyte channels in primary rat astrocytes.J Physiol. 2017 Nov 15;595(22):6939-6951. doi: 10.1113/JP275053. Epub 2017 Sep 12. J Physiol. 2017. PMID: 28833202 Free PMC article.
-
Intracellular and extracellular loops of LRRC8 are essential for volume-regulated anion channel function.J Gen Physiol. 2018 Jul 2;150(7):1003-1015. doi: 10.1085/jgp.201812016. Epub 2018 May 31. J Gen Physiol. 2018. PMID: 29853476 Free PMC article.
-
Regulation of Anion Channel LRRC8 Volume-Regulated Anion Channels in Transport of 2'3'-Cyclic GMP-AMP and Cisplatin under Steady State and Inflammation.J Immunol. 2021 May 1;206(9):2061-2074. doi: 10.4049/jimmunol.2000989. Epub 2021 Apr 7. J Immunol. 2021. PMID: 33827893
-
VRAC: molecular identification as LRRC8 heteromers with differential functions.Pflugers Arch. 2016 Mar;468(3):385-93. doi: 10.1007/s00424-015-1766-5. Epub 2015 Dec 3. Pflugers Arch. 2016. PMID: 26635246 Review.
-
Biophysics and Structure-Function Relationships of LRRC8-Formed Volume-Regulated Anion Channels.Biophys J. 2019 Apr 2;116(7):1185-1193. doi: 10.1016/j.bpj.2019.02.014. Epub 2019 Feb 26. Biophys J. 2019. PMID: 30871717 Free PMC article. Review.
Cited by
-
VRACs and other ion channels and transporters in the regulation of cell volume and beyond.Nat Rev Mol Cell Biol. 2016 May;17(5):293-307. doi: 10.1038/nrm.2016.29. Epub 2016 Apr 1. Nat Rev Mol Cell Biol. 2016. PMID: 27033257 Review.
-
Specific and essential but not sufficient roles of LRRC8A in the activity of volume-sensitive outwardly rectifying anion channel (VSOR).Channels (Austin). 2017 Mar 4;11(2):109-120. doi: 10.1080/19336950.2016.1247133. Epub 2016 Oct 20. Channels (Austin). 2017. PMID: 27764579 Free PMC article.
-
Zinc pyrithione activates the volume-regulated anion channel through an antioxidant-sensitive mechanism.Am J Physiol Cell Physiol. 2021 Jun 1;320(6):C1088-C1098. doi: 10.1152/ajpcell.00070.2021. Epub 2021 Apr 7. Am J Physiol Cell Physiol. 2021. PMID: 33826406 Free PMC article.
-
Ion Channel Involvement in Tumor Drug Resistance.J Pers Med. 2022 Feb 3;12(2):210. doi: 10.3390/jpm12020210. J Pers Med. 2022. PMID: 35207698 Free PMC article. Review.
-
Pooled Genomic Screens Identify Anti-apoptotic Genes as Targetable Mediators of Chemotherapy Resistance in Ovarian Cancer.Mol Cancer Res. 2019 Nov;17(11):2281-2293. doi: 10.1158/1541-7786.MCR-18-1243. Epub 2019 Aug 28. Mol Cancer Res. 2019. PMID: 31462500 Free PMC article.
References
-
- Abascal F, Zardoya R (2012) LRRC8 proteins share a common ancestor with pannexins, and may form hexameric channels involved in cell‐cell communication. BioEssays 34: 551–560 - PubMed
-
- d'Anglemont de Tassigny A, Berdeaux A, Souktani R, Henry P, Ghaleh B (2008) The volume‐sensitive chloride channel inhibitors prevent both contractile dysfunction and apoptosis induced by doxorubicin through PI3kinase, Akt and Erk 1/2. Eur J Heart Fail 10: 39–46 - PubMed
-
- Berndtsson M, Hagg M, Panaretakis T, Havelka AM, Shoshan MC, Linder S (2007) Acute apoptosis by cisplatin requires induction of reactive oxygen species but is not associated with damage to nuclear DNA. Int J Cancer 120: 175–180 - PubMed
-
- Borst P, Borst J, Smets LA (2001) Does resistance to apoptosis affect clinical response to antitumor drugs? Drug Resist Updat 4: 129–131 - PubMed
-
- Borst P, Rottenberg S, Jonkers J (2008) How do real tumors become resistant to cisplatin? Cell Cycle 7: 1353–1359 - PubMed
MeSH terms
Substances
LinkOut - more resources
Full Text Sources
Other Literature Sources
Molecular Biology Databases
