ZIFA: Dimensionality reduction for zero-inflated single-cell gene expression analysis
- PMID: 26527291
- PMCID: PMC4630968
- DOI: 10.1186/s13059-015-0805-z
ZIFA: Dimensionality reduction for zero-inflated single-cell gene expression analysis
Abstract
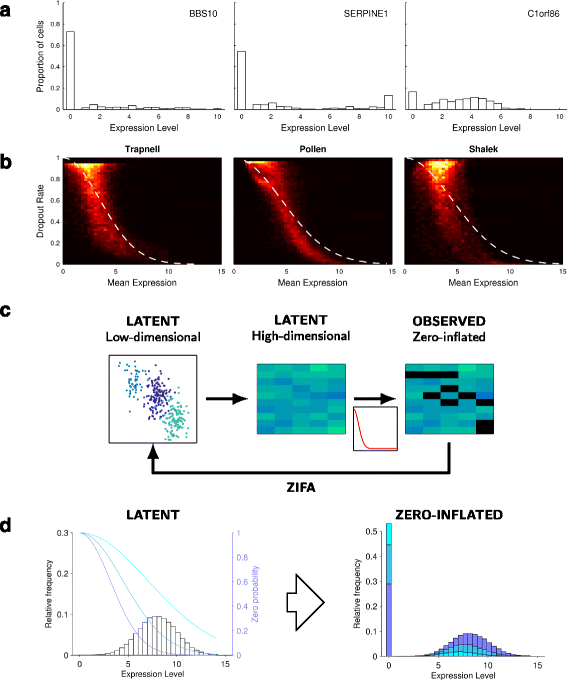
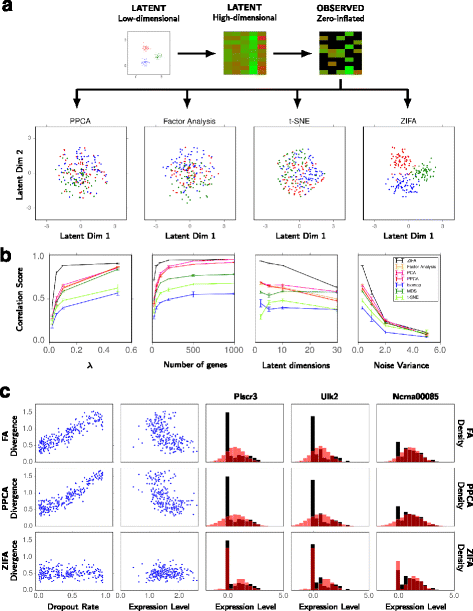
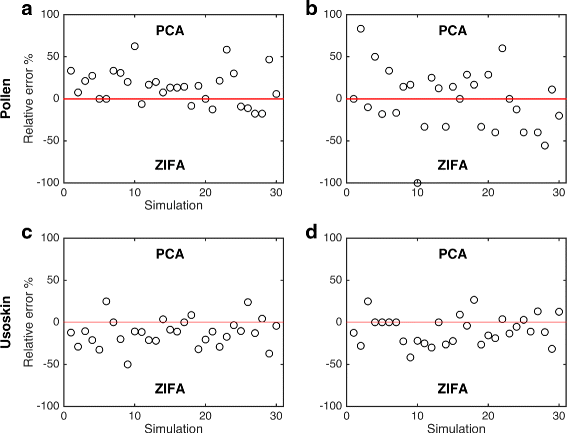
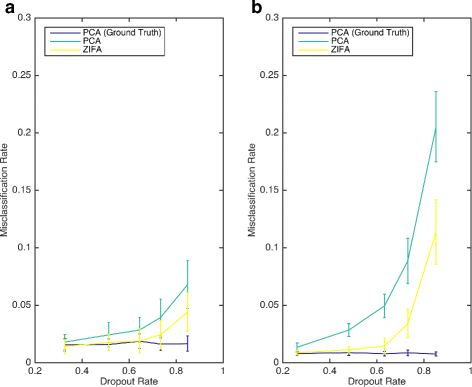
Single-cell RNA-seq data allows insight into normal cellular function and various disease states through molecular characterization of gene expression on the single cell level. Dimensionality reduction of such high-dimensional data sets is essential for visualization and analysis, but single-cell RNA-seq data are challenging for classical dimensionality-reduction methods because of the prevalence of dropout events, which lead to zero-inflated data. Here, we develop a dimensionality-reduction method, (Z)ero (I)nflated (F)actor (A)nalysis (ZIFA), which explicitly models the dropout characteristics, and show that it improves modeling accuracy on simulated and biological data sets.
Figures
Similar articles
-
CIDR: Ultrafast and accurate clustering through imputation for single-cell RNA-seq data.Genome Biol. 2017 Mar 28;18(1):59. doi: 10.1186/s13059-017-1188-0. Genome Biol. 2017. PMID: 28351406 Free PMC article.
-
Visualization of Single Cell RNA-Seq Data Using t-SNE in R.Methods Mol Biol. 2020;2117:159-167. doi: 10.1007/978-1-0716-0301-7_8. Methods Mol Biol. 2020. PMID: 31960377
-
FastProject: a tool for low-dimensional analysis of single-cell RNA-Seq data.BMC Bioinformatics. 2016 Aug 23;17(1):315. doi: 10.1186/s12859-016-1176-5. BMC Bioinformatics. 2016. PMID: 27553427 Free PMC article.
-
Bayesian gamma-negative binomial modeling of single-cell RNA sequencing data.BMC Genomics. 2020 Sep 9;21(Suppl 9):585. doi: 10.1186/s12864-020-06938-8. BMC Genomics. 2020. PMID: 32900358 Free PMC article.
-
Machine learning and statistical methods for clustering single-cell RNA-sequencing data.Brief Bioinform. 2020 Jul 15;21(4):1209-1223. doi: 10.1093/bib/bbz063. Brief Bioinform. 2020. PMID: 31243426 Review.
Cited by
-
Latent Factor Modeling of scRNA-Seq Data Uncovers Dysregulated Pathways in Autoimmune Disease Patients.iScience. 2020 Aug 12;23(9):101451. doi: 10.1016/j.isci.2020.101451. eCollection 2020 Sep 25. iScience. 2020. PMID: 32853994 Free PMC article.
-
Machine Intelligence in Single-Cell Data Analysis: Advances and New Challenges.Front Genet. 2021 May 31;12:655536. doi: 10.3389/fgene.2021.655536. eCollection 2021. Front Genet. 2021. PMID: 34135939 Free PMC article. Review.
-
SIMPLEs: a single-cell RNA sequencing imputation strategy preserving gene modules and cell clusters variation.NAR Genom Bioinform. 2020 Dec;2(4):lqaa077. doi: 10.1093/nargab/lqaa077. Epub 2020 Sep 28. NAR Genom Bioinform. 2020. PMID: 33029585 Free PMC article.
-
Coupling gene expression dynamics to cell size dynamics and cell cycle events: Exact and approximate solutions of the extended telegraph model.iScience. 2022 Dec 7;26(1):105746. doi: 10.1016/j.isci.2022.105746. eCollection 2023 Jan 20. iScience. 2022. PMID: 36619980 Free PMC article.
-
Differential Expression Analysis of Single-Cell RNA-Seq Data: Current Statistical Approaches and Outstanding Challenges.Entropy (Basel). 2022 Jul 18;24(7):995. doi: 10.3390/e24070995. Entropy (Basel). 2022. PMID: 35885218 Free PMC article. Review.
References
Publication types
MeSH terms
Grants and funding
LinkOut - more resources
Full Text Sources
Other Literature Sources

