. 2015 Dec;17(12):1597-606.
doi: 10.1038/ncb3268. Epub 2015 Nov 2.

Extracellular rigidity sensing by talin isoform-specific mechanical linkages

Affiliations

Extracellular rigidity sensing by talin isoform-specific mechanical linkages

Katharina Austen et al. Nat Cell Biol. 2015 Dec.

Abstract

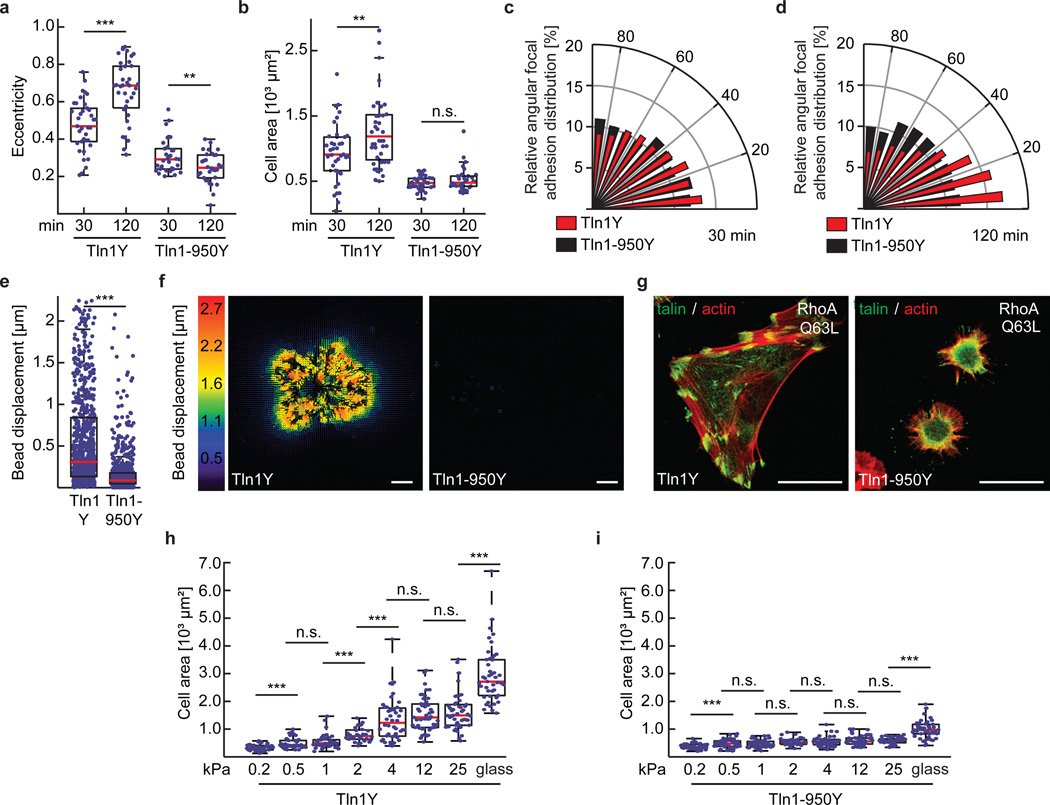
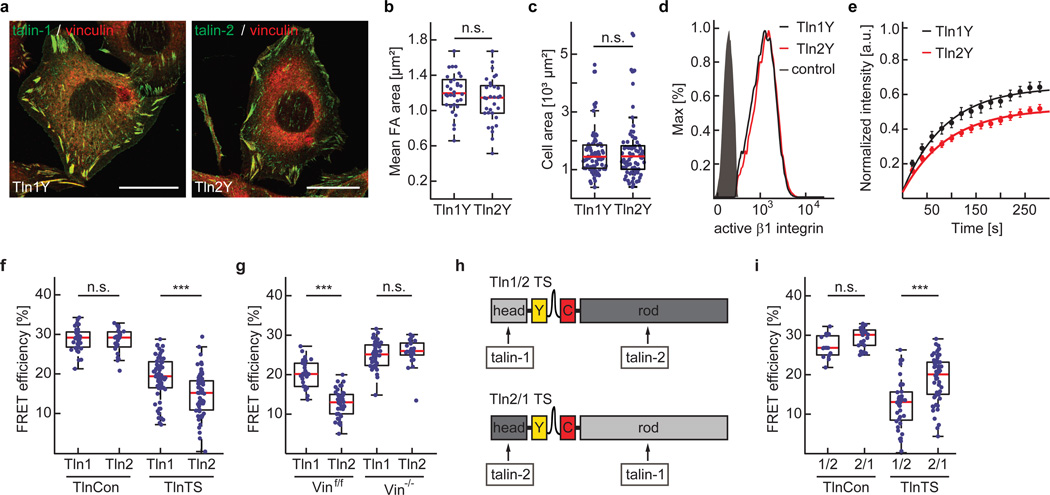
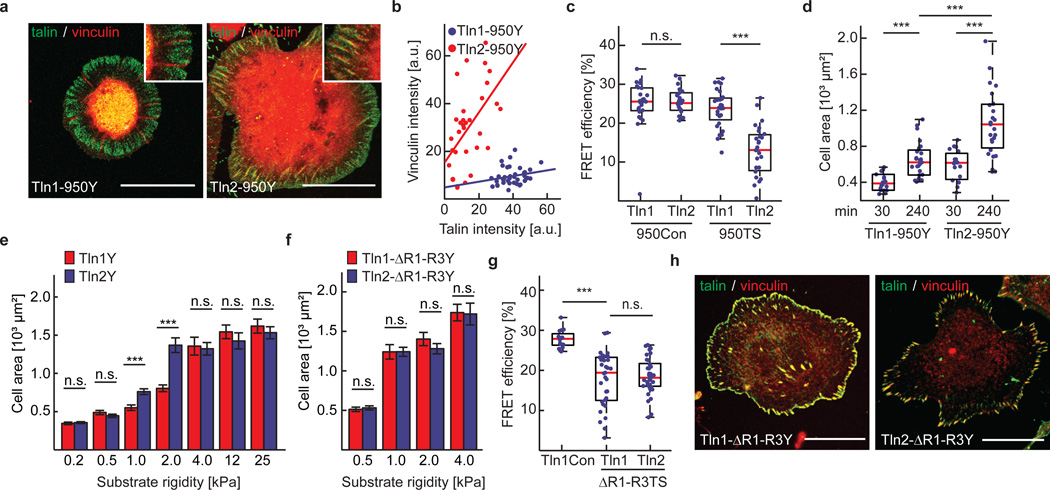
The ability of cells to adhere and sense differences in tissue stiffness is crucial for organ development and function. The central mechanisms by which adherent cells detect extracellular matrix compliance, however, are still unknown. Using two single-molecule-calibrated biosensors that allow the analysis of a previously inaccessible but physiologically highly relevant force regime in cells, we demonstrate that the integrin activator talin establishes mechanical linkages following cell adhesion, which are indispensable for cells to probe tissue stiffness. Talin linkages are exposed to a range of piconewton forces and bear, on average, 7-10 pN during cell adhesion depending on their association with F-actin and vinculin. Disruption of talin's mechanical engagement does not impair integrin activation and initial cell adhesion but prevents focal adhesion reinforcement and thus extracellular rigidity sensing. Intriguingly, talin mechanics are isoform specific so that expression of either talin-1 or talin-2 modulates extracellular rigidity sensing.


Figures

Figure 1
Figure 1
Biosensor calibration using single-molecule force spectroscopy. (a) HP35-TS comprises two fluorophores, YPet and mCherry (mCh), which are linked by the villin headpiece peptide (HP35). Mechanical force across this biosensor leads to HP35 unfolding, increase in fluorophore separation distance and reduced FRET. For single-molecule (sm) calibration, DNA handles were attached using cysteines (C), a His-tag was used for purification. (b) Schematic illustration of the custom-built dual trap optical tweezer setup used for calibration. (c) 200 kHz resolution force-extension trace (FE) (gray) fitted with an extensible worm-like chain model (black). Inset: Zoom into representative FEs of individual HP35(st)-TS molecules as compared to DNA; the fit to HP35-TS data is shown in blue, HP35-st-TS in red and DNA in black. (d) Average FE of individual HP35-TS (blue) and HP35st-TS (red) molecules. Experimental data are shown as filled squares, solid lines are fits to the data, empty circles represent transition mid-point forces (HP35-TS: n=344 single pulls pooled from 15 independent repeats, i.e. different molecules; HP35st-TS: n=338 single pulls pooled from 10 independent repeats). (e) FE of four representative HP35-TS molecules showing fluorophore unfolding at high (>35 pN) forces. (f) After stretching to 24 pN, HP35-TS was exposed to high force for more than five min before relaxation; no indications of fluorophore unfolding were observed. (g) Average force-extension fit for HP35st-TS using a three-state model. The dashed black line represents the folded state, the gray dashed line the half-folded/half-unfolded state with contour length and the black solid line the completely unfolded state with contour length ; the red line indicates the average protein extension (h) Probability plot for the folded, half-folded/half-unfolded and unfolded state. (i) Modelled FRET-force (solid lines) and extension-force (dashed lines) correlations of HP35(st)-TS.
Figure 2
Figure 2
Generation and evaluation of a talin-1 tension sensor. (a) Schematic illustrations of C-terminally YPet-tagged talin1 (Tln1Y), the talin1-HP35 tension sensor (Tln1TS) and the talin-1 zero force control (Tln1Con). (b) Representative images from 4 independent experiments showing Tln1−/−Tln2−/− cells expressing Tln1Y, Tln1TS or Tln1Con. Talin constructs are shown in green, paxillin in red; scale bars, 20 µm. (c) FRAP analyses demonstrating normal FA turnover rates of Tln1Y (black) and Tln1TS (red). Error bars indicate s.e.m; n=21 and 24 cells respectively for Tln1Y and Tln1TS, pooled from 5 independent experiments. (d) Live cell fluorescence lifetimes of internally and C-terminally tagged talin-1 constructs expressed in Tln1−/−Tln2−/− cells (n=29, 28, 30, 23 cells respectively from left to right, 3 independent experiments). (e) Live cell emission spectra of FA-localized Tln1Y-i (single measurements: dark gray lines, mean: black line) and Tln1Y (single measurements: light gray lines, mean: red line). Error bars indicate s.e.m; n=10 and 10 cells, 3 independent experiments. (f) Live cell emission spectra of FA-localized Tln1C-i (single measurements: dark gray lines, mean: black line) and Tln1C (single measurements: light gray lines, mean: red line). Error bars indicate s.e.m; n=10 (Tln1C-i) and 10 (Tln1C) cells, 3 independent experiments. (g) Intermolecular FRET analysis in Tln1−/−Tln2−/− cells co-expressing Tln1C-i/Tln1Y-i or Tln1C/Tln1Y on FN- or pL-coated glass coverslips (n=35, 28, 44, 36 cells respectively from left to right; 3 independent experiments). (h) No FRET efficiency differences in cells expressing Tln1TS (wt), Tln1TS-M319A (MA) and Tln1TS-K324D (KD) when seeded on pL-coated glass coverslips (n=39, 40, 42 cells respectively from left to right; 3 independent experiments) (i) Live-cell FLIM analysis demonstrating decreased FRET efficiency in Tln1TS cells when seeded on FN-coated surfaces indicating tension across talin-1 (n=35, 56, 102, 115 cells respectively from left to right; 5 independent experiments). (j) Representative ratiometric FA-FRET images of non-motile Tln1Con and Tln1TS cells confirming reduced FRET in Tln1TS cells; scale bars, 20 µm (3 independent experiments). (k) Mean ratiometric FA-FRET in Tln1Con and Tln1TS cells (n=32 and 47 cells respectively for Tln1Con and Tln1TS; 3 independent experiments). (d, g, h, i,:, Kolmogorov-Smirnov test, ***: p<0.001; **: p<0.01; *: p<0.05; not significant (n.s.): p > 0.05). Boxplots indicate the median (red line) as well as 25th and 75th percentiles; whiskers reach out to 2.7 standard deviations (σ). Statistic source data are available in Supplementary Table 1.
Figure 3
Figure 3
Talin-1 mediates a constitutive mechanical linkage in FAs that is modulated by f-actin and vinculin association. (a) Treatment of cells with 10 µM Y-27632 (inh) induces an increase in average FRET efficiency specifically in Tln1TS cells (n=26, 42, 32 and 42 respectively from left to right; pooled from 3 independent experiments). (b) Comparing HP35-TS (7 pN) with HP35st-TS (10 pN)–based talin sensors in cells on FN- or pL-coated surfaces suggests that most talin-1 linkages experience force of more than 7 pN, some even more than 10 pN (n=52, 53, 32 and 40 cells respectively from left to right; 4 independent experiments). (c) FRET efficiencies in Tln1Con cells seeded on FN-coated glass coverslips (n=68) and in Tln1TS cells seeded on FN-coated 25 kPa (n=61), 12 kPa (n=58), 4 kPa (n=64), 2 kPa (n=40), 1 kPa (n=58) and 0.5 kPa (n=81) matrices; n represents the number of cells that were pooled from 5 independent experiments. (d) Rigidity-dependent traction force increase of Tln1Y cells seeded on FN-coated polyacrylamide gels with elastic moduli of 3.2 kPa (n=20), 6.3 kPa (n=16), 24.7 kPa (n=30) and 52 kPa (n=15); n represents the number of cells that were pooled from 3 independent experiments. Single data points represent traction forces from displacement of every hundredth bead. (e) Depletion of vinculin leads to an increase in FRET while treatment of Tln1TS-expressing Vin−/− cells with 10 µM Y-27632 further increases transfer rates indicating loss of vinculin leads to a reduction but not entire loss of talin tension (n=15, 17 and 29 cells respectively from left to right, pooled from 7 independent experiments). (f) The HP35-based sensor monitors talin-1 tension more efficiently than a biosensor using TSMod (n=22, 25, 14 and 15 cells respectively from left to right, 5 independent experiments). (g) TSMod does not properly resolve vinculin-dependent differences in talin-1 tension (n=29, 28, 25 and 41 cells respectively from left to right, 3 independent experiments). (a–c and e–g, Kolmogorov-Smirnov test; d, Wilcoxon–Mann–Whitney test. ***: p<0.001; **: p<0.01; *: p<0.05; not significant (n.s.): p > 0.05). Boxplots indicate the median (red line) as well as 25th and 75th percentiles; whiskers reach out to 2.7 standard deviations (σ). Statistic source data are available in Supplementary Table 1.
Figure 4
Figure 4
The talin-rod’s cytoskeletal engagement is essential for vinculin recruitment and talin tension but indispensable for integrin activation. (a) Schematic illustration of Tln1Y, Tln1-2300Y and Tln1950Y constructs; blue lines indicate VBS, white boxes ABS, yellow boxes the C-terminal YPet-tag. (b) Representative images from 3 independent experiments showing Tln1−/−Tln2−/− cells stably expressing Tln1Y, Tln1-2300Y and Tln1-950Y cells (green) stained with vinculin (red); scale bars, 20 µm. (c) Talin-1/vinculin FA co-localization analysis demonstrating the lack of vinculin recruitment to talin-positive adhesion sites in Tln1-950Y cells (n=32 (Tln1Y) and 33 (Tln1-950Y) FAs, pooled from 3 independent experiments). Pearson correlation coefficient (talin vs vinculin intensity): Tln1Y=0.8060, Tln1-950Y=0.2424. (d) Moderate reduction in talin-1 tension upon deletion of the dimerization domain and C-terminal ABS (Tln1-2300) (n=39 (Tln1TS) and 21 (Tln1-2300TS) cells, 4 independent experiments). (e) Loss of talin-1 tension in Tln1-950 cells (n=17 (Tln1TS) and 19 (Tln1-950TS), 4 independent experiments). (f, g) Representative FACS histograms of 4 independent experiments showing cells expressing Tln1Y (black), Tln1-2300Y (red) and Tln1950Y (blue) labelled for (f) beta1 integrin or (g) active beta1 integrin (9EG7); the negative control is shown in gray. Tln1950Y cells display normal integrin expression and activation. (h) Representative images from 3 independent experiments showing Tln1−/−Tln2−/− cells reconstituted with Tln1950Y (green) and labelled for active beta-1 integrin or kindlin-2 (red). The recruitment of kindlin-2 in Tln1950Y cells is consistent with normal integrin activation and cell adhesion; scale bars, 20 µm. (d, e, Kolmogorov-Smirnov test. ***: p<0.001; *: p<0.05). Boxplots indicate the median (red line) as well as 25th and 75th percentiles; whiskers reach out to 2.7 standard deviations (σ). Statistic source data are available in Supplementary Table 1.
Figure 5
Figure 5
Cytoskeletal engagement of the talin-1 rod domain is indispensable for cell spreading, polarization, traction force generation and extracellular rigidity sensing. (a) Cellular eccentricity and (b) cell area of Tln1Y and Tln1-950Y cells after 30 min or 120 min of spreading on FN-coated glass coverslips; Tln1-950Y cells are unable to polarize and spread (in a and b: n=37, 36, 31 and 32 cells respectively from left to right, pooled from 3 independent experiments). (c, d) Relative angular FA distribution in Tln1Y cells (red) and Tln1950Y cells (black) after (c) 30 min and (d) 120 min of spreading on FN-coated glass coverslips indicating lack of polarization in Tln1950Y cells (in c and d: n=37 (Tln1Y 30 min), 36 (Tln1-950Y 30 min), 31 (Tln1Y 120 min) and 32 (Tln1-950Y 120 min) cells, 3 independent experiments). (e) Bead displacements observed under Tln1Y (n=21) and Tln1-950Y (n=22) cells cultured on 2 kPa polyacrylamide gels; data were pooled from 4 independent experiments. Tln1-950Y cells are characterized by significantly lower traction forces indicated by very small bead displacements. (f) Representative displacement images (4 independent experiments, corresponding quantification shown in e) of Tln1Y and Tln1-950Y cells indicating the virtual absence of traction forces in Tln1-950Y cells; scale bar, 10 µm. (g) Representative images from 3 independent experiments showing Tln1Y and Tln1-950Y cells (green) expressing active RhoAQ63L, stained for f-actin (red); Tln1-950Y cells fail to reinforce their FAs; scale bars, 20 µm. (h, i) Cell area of (h) Tln1Y and (i) Tln1-950Y cells after overnight culture on glass or FN-coated polyacrylamide gels with the indicated elastic moduli ranging from 0.2–25 kPa; Tln1Y (n=45, 45, 45, 32, 44, 47, 47 and 45 cells respectively from left to right, 3 independent experiments), Tln1-950Y (n=47, 49, 47, 32, 47, 46, 46 and 45 cells respectively from left to right, 3 independent experiments). Note that Tln1-950Y cells fail to distinguish rigidity differences. (a, b, h, i: two sided t-test; e, Wilcoxon–Mann–Whitney test. ***: p<0.001; **: p<0.01; *: p<0.05; not significant (n.s.): p > 0.05). Boxplots indicate the median (red line) as well as 25th and 75th percentiles; whiskers reach out to 2.7 standard deviations (σ). Statistic source data are available in Supplementary Table 1.
Figure 6
Figure 6
Talin-1 and talin-2 both rescue cell spreading and integrin activation but they transduce mechanical forces differently. (a) Representative images (3 independent experiments) of Tln1−/−Tln2−/− cells reconstituted with Tln1Y or Tln2Y (green) and labelled for vinculin (red). Cell lines are indistinguishable when cultured on plastic or glass coverslips; scale bars, 20 µm. (b) Mean FA area (n=30 (Tln1Y) and 34 (Tln2Y) cells; pooled from 4 independent experiments) and (c) mean cell area (n=77 (Tln1Y) and 77 (Tln2Y) cells; 4 independent experiments) determined from Tln1Y and Tln2Y cells seeded on FN-coated glass coverslips. (d) Representative FACS histogram of cells expressing Tln1Y (black) or Tln2Y (red) labelled for active beta1 integrin; the negative control is shown in gray. (4 independent experiments) (e) Normalized fluorescence recovery rates of Tln1Y (black, n=18 cells) and Tln2Y cells (red, n=17 cells) as determined by live cell FRAP experiments. Cells were pooled from 3 independent experiments; error bars indicate s.e.m. (f) FRET efficiencies in Tln1Con, Tln2Con, Tln1TS and Tln2TS cells (n=35, 25, 63 and 63 cells respectively from left to right, 3 independent experiments) indicating increased tension across talin-2. (g) Isoform-specific tension differences are abolished in vinculin-deficient cells (n=28, 41, 42 and 24 cells respectively from left to right; 3 independent experiments). (h) Schematic illustrations of chimeric talin-1–head/talin-2–rod (Tln1/2-TS) and talin-2–head/talin-1–rod (Tln2/1-TS) tension sensor constructs. (i) FRET analysis of chimeric talin constructs demonstrating that the isoform-specific tension increase is talin-rod–dependent (n=15, 24, 43 and 58 cells respectively from left to right; 7 independent experiments). (b, c two sited t-test; f, g, i, Kolmogorov-Smirnov test. ***: p<0.001; **: p<0.01; *: p<0.05; not significant (n.s.): p > 0.05). Boxplots indicate the median (red line) as well as 25th and 75th percentiles; whiskers reach out to 2.7 standard deviations (σ). Statistic source data are available in Supplementary Table 1.
Figure 7
Figure 7
Talin-isoform–specific differences are mediated by domains R1–R3. (a) Representative images from 3 independent experiments showing that vinculin (red) colocalizes with Tln2-950Y but not with Tln1-950Y adhesion sites; scale bar, 20 µm. (b) Quantification of talin/vinculin co-localization in adhesion sites of Tln1-950Y (n=32 adhesions) and Tln2-950Y (n=38 adhesions) expressing cells; n values represent pooled adhesions from 3 independent experiments. Pearson correlation coefficient (talin vs vinculin intensity): Tln1-950Y=0.2214, Tln2-950Y=0.5323. (c) Deletion of C-terminal ABS abolishes tension across talin-1 but not across talin-2 (n=24, 21, 28 and 25 cells respectively from left to right; 5 independent experiments). (d) Cell area of Tln1-950Y and Tln2-950Y cells after 30 min and 240 min spreading on FN-coated glass coverslips (n=18, 27, 19 and 27 cells respectively from left to right; 3 independent experiments).(e) Cell area quantification of Tln1Y and Tln2Y cells seeded on FN-coated substrates of indicated stiffness; Tln2Y cells respond differently on 1 kPa and 2 kPa matrices (n=47, 49, 45, 46, 45, 48, 32, 30, 44, 47, 48, 48, 46 and 46 cells respectively from left to right; 3 independent experiments; data are means ± s.e.m.). (f) No differences in cell spreading of Tln1-ΔR1R3Y (n=50 (0.5 kPa), 50 (1 kPa), 53 (2 kPa) and 47 (4 kPa) cells) and Tln2-ΔR1R3Y cells (n= 52 (0.5 kPa), 47 (1 kPa), 47 (2 kPa) and 47 (4 kPa) cells). Cells were pooled from 3 independent experiments; data are means ± s.e.m. (g) FRET analysis of talin-deficient cells expressing Tln1-ΔR1R3TS and Tln2-ΔR1R3TS constructs seeded on FN-coated glass coverslips (n=16, 33 and 37 cells respectively from left to right; 3 independent experiments). (h) Representative images from 3 independent experiments showing Tln1-ΔR1R3Y and Tln2-ΔR1R3Y cells on FN-coated glass coverslips stained for vinculin; the talin signal is labelled in green, the vinculin signal is shown in red; scale bars, 20 µm. (c, g: Kolmogorov-Smirnov test; d–f: two sided t-test. ***: p<0.001; not significant (n.s.): p > 0.05). Boxplots indicate the median (red line) as well as 25th and 75th percentiles; whiskers reach out to 2.7 standard deviations (σ). Statistic source data are available in Supplementary Table 1.

Comment in

  • Sensing some tension.
    Vogt N. Vogt N. Nat Methods. 2016 Jan;13(1):17. doi: 10.1038/nmeth.3726. Nat Methods. 2016. PMID: 27110628 No abstract available.

Similar articles

Cited by

References

    1. Heisenberg CP, Bellaiche Y. Forces in tissue morphogenesis and patterning. Cell. 2013;153:948–962. - PubMed
    1. Wozniak MA, Chen CS. Mechanotransduction in development: a growing role for contractility. Nat. Rev. Mol. Cell Biol. 2009;10:34–43. - PMC - PubMed
    1. Franze K, Janmey PA, Guck J. Mechanics in neuronal development and repair. Annu. Rev. Biomed. Eng. 2013;15:227–251. - PubMed
    1. Ingber DE. Mechanobiology and diseases of mechanotransduction. Ann. Med. 2003;35:564–577. - PubMed
    1. Lu P, Takai K, Weaver VM, Werb Z. Extracellular matrix degradation and remodeling in development and disease. Cold Spring Harb. Perspect. Biol. 2011;3 - PMC - PubMed

Publication types

MeSH terms