Regulation of cellular sphingosine-1-phosphate by sphingosine kinase 1 and sphingosine-1-phopshate lyase determines chemotherapy resistance in gastroesophageal cancer
- PMID: 26493335
- PMCID: PMC4618539
- DOI: 10.1186/s12885-015-1718-7
Regulation of cellular sphingosine-1-phosphate by sphingosine kinase 1 and sphingosine-1-phopshate lyase determines chemotherapy resistance in gastroesophageal cancer
Abstract
Background: Resistance to chemotherapy is common in gastroesophageal cancer. Mechanisms of resistance are incompletely characterised and there are no predictive biomarkers in clinical practice for cytotoxic drugs. We used new cell line models to characterise novel chemotherapy resistance mechanisms and validated them in tumour specimens to identify new targets and biomarkers for gastroesophageal cancer.
Methods: Cell lines were selected for resistance to oxaliplatin, cisplatin and docetaxel and gene expression examined using Affymetrix Exon 1.0 ST arrays. Leads were validated by qRT-PCR and HPLC of tumour metabolites. Protein expression and pharmacological inhibition of lead target SPHK1 was evaluated in independent cell lines, and by immunohistochemistry in gastroesophageal cancer patients.
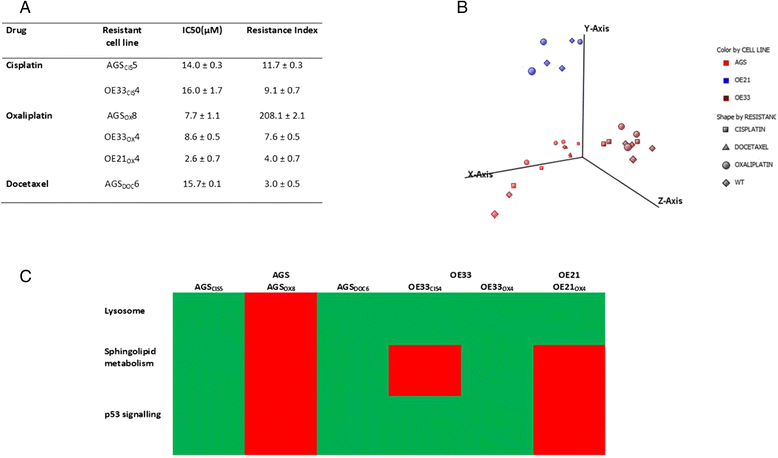
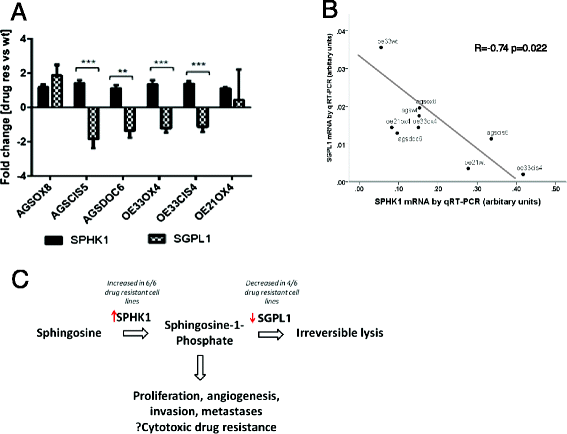
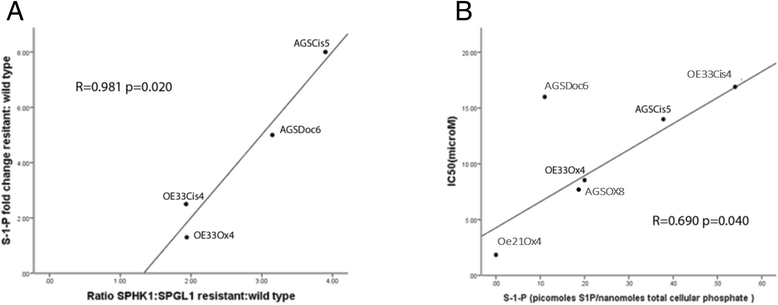
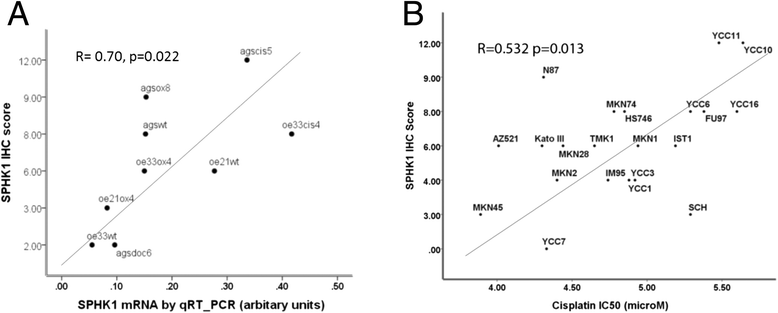
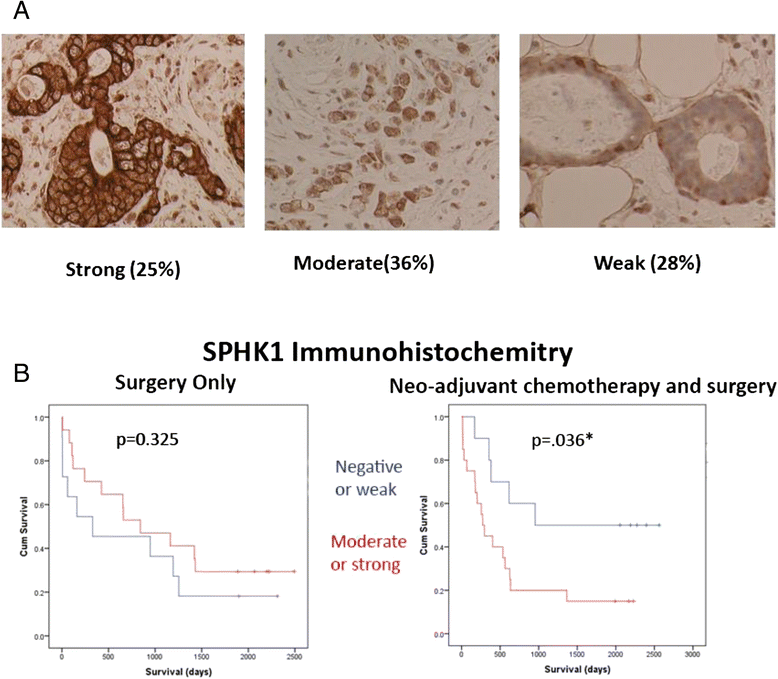
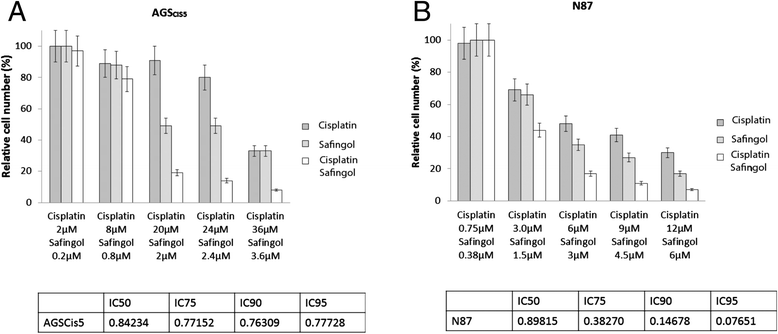
Results: Genes with differential expression in drug resistant cell lines compared to the parental cell line they were derived from, were identified for each drug resistant cell line. Biological pathway analysis of these gene lists, identified over-represented pathways, and only 3 pathways - lysosome, sphingolipid metabolism and p53 signalling- were identified as over-represented in these lists for all three cytotoxic drugs investigated. The majority of genes differentially expressed in chemoresistant cell lines from these pathways, were involved in metabolism of glycosphingolipids and sphingolipids in lysosomal compartments suggesting that sphingolipids might be important mediators of cytotoxic drug resistance in gastroeosphageal cancers . On further investigation, we found that drug resistance (IC50) was correlated with increased sphingosine kinase 1(SPHK1) mRNA and also with decreased sphingosine-1-phosphate lysase 1(SGPL1) mRNA. SPHK1 and SGPL1 gene expression were inversely correlated. SPHK1:SGPL1 ratio correlated with increased cellular sphingosine-1-phosphate (S1P), and S1P correlated with drug resistance (IC50). High SPHK1 protein correlated with resistance to cisplatin (IC50) in an independent gastric cancer cell line panel and with survival of patients treated with chemotherapy prior to surgery but not in patients treated with surgery alone. Safingol a SPHK1 inhibitor, was cytotoxic as a single agent and acted synergistically with cisplatin in gastric cancer cell lines.
Conclusion: Agents that inhibit SPHK1 or S1P could overcome cytotoxic drug resistance in gastroesophageal cancer. There are several agents in early phase human trials including Safingol that could be combined with chemotherapy or used in patients progressing after chemotherapy.
Figures
Similar articles
-
First evidence of sphingosine 1-phosphate lyase protein expression and activity downregulation in human neoplasm: implication for resistance to therapeutics in prostate cancer.Mol Cancer Ther. 2012 Sep;11(9):1841-51. doi: 10.1158/1535-7163.MCT-12-0227. Epub 2012 Jul 10. Mol Cancer Ther. 2012. PMID: 22784711
-
Aberrant expression of the S1P regulating enzymes, SPHK1 and SGPL1, contributes to a migratory phenotype in OSCC mediated through S1PR2.Sci Rep. 2016 May 10;6:25650. doi: 10.1038/srep25650. Sci Rep. 2016. PMID: 27160553 Free PMC article.
-
Sphingosine-1-phosphate/sphingosine kinase 1-dependent lymph node metastasis in esophageal squamous cell carcinoma.Surg Today. 2017 Nov;47(11):1312-1320. doi: 10.1007/s00595-017-1514-x. Epub 2017 Mar 31. Surg Today. 2017. PMID: 28364399
-
Sphingolipids in pulmonary fibrosis.Adv Biol Regul. 2015 Jan;57:55-63. doi: 10.1016/j.jbior.2014.09.008. Epub 2014 Oct 13. Adv Biol Regul. 2015. PMID: 25446881 Free PMC article. Review.
-
The sphingosine kinase-1/sphingosine-1-phosphate axis in cancer: Potential target for anticancer therapy.Pharmacol Ther. 2019 Mar;195:85-99. doi: 10.1016/j.pharmthera.2018.10.011. Epub 2018 Oct 19. Pharmacol Ther. 2019. PMID: 30347210 Review.
Cited by
-
miR-659-3p is involved in the regulation of the chemotherapy response of colorectal cancer via modulating the expression of SPHK1.Am J Cancer Res. 2016 Sep 1;6(9):1976-1985. eCollection 2016. Am J Cancer Res. 2016. PMID: 27725903 Free PMC article.
-
Functional roles of sphingolipids in immunity and their implication in disease.Exp Mol Med. 2023 Jun;55(6):1110-1130. doi: 10.1038/s12276-023-01018-9. Epub 2023 Jun 1. Exp Mol Med. 2023. PMID: 37258585 Free PMC article. Review.
-
Insulin-like growth factor receptor and sphingosine kinase are prognostic and therapeutic targets in breast cancer.BMC Cancer. 2017 Dec 5;17(1):820. doi: 10.1186/s12885-017-3809-0. BMC Cancer. 2017. PMID: 29207959 Free PMC article.
-
The effect of S1P receptor signaling pathway on the survival and drug resistance in multiple myeloma cells.Mol Cell Biochem. 2017 Jan;424(1-2):185-193. doi: 10.1007/s11010-016-2854-3. Epub 2016 Oct 27. Mol Cell Biochem. 2017. PMID: 27785703
-
SPHK1-induced autophagy in peritoneal mesothelial cell enhances gastric cancer peritoneal dissemination.Cancer Med. 2019 Apr;8(4):1731-1743. doi: 10.1002/cam4.2041. Epub 2019 Feb 21. Cancer Med. 2019. PMID: 30791228 Free PMC article.
References
-
- Cunningham D, Allum W, Stenning S, Thompson J, VandeVelde CH, Nicolson M, Scarffe JH, Lofts F, Falk S, Iveson T, Smith D, Langley R, Verma M, Weeden S, Chua Y, theMAGICTrialParticipants Perioperative chemotherapy versus surgery alone for resectable gastroesophageal cancer. N Engl J Med. 2006;355(1):11–20. doi: 10.1056/NEJMoa055531. - DOI - PubMed
-
- Van Cutsem E, Moiseyenko VM, Tjulandin S, Majlis A, Constenla M, Boni C, Rodrigues A, Fodor M, Chao Y, Voznyi E, Risse M, Ajani JA. Phase III study of docetaxel and cisplatin plus fluorouracil compared with cisplatin and fluorouracil as first-line therapy for advanced gastric cancer: a report of the V325 study group. J Clin Oncol. 2006;24(31):4991–4997. doi: 10.1200/JCO.2006.06.8429. - DOI - PubMed
Publication types
MeSH terms
Substances
Grants and funding
LinkOut - more resources
Full Text Sources
Other Literature Sources
Medical
Research Materials
Miscellaneous

