. 2015 Nov;10(11):1860-1896.
doi: 10.1038/nprot.2015.122. Epub 2015 Oct 22.

Whole-body tissue stabilization and selective extractions via tissue-hydrogel hybrids for high-resolution intact circuit mapping and phenotyping

Affiliations

Whole-body tissue stabilization and selective extractions via tissue-hydrogel hybrids for high-resolution intact circuit mapping and phenotyping

Jennifer B Treweek et al. Nat Protoc. 2015 Nov.

Abstract

To facilitate fine-scale phenotyping of whole specimens, we describe here a set of tissue fixation-embedding, detergent-clearing and staining protocols that can be used to transform excised organs and whole organisms into optically transparent samples within 1-2 weeks without compromising their cellular architecture or endogenous fluorescence. PACT (passive CLARITY technique) and PARS (perfusion-assisted agent release in situ) use tissue-hydrogel hybrids to stabilize tissue biomolecules during selective lipid extraction, resulting in enhanced clearing efficiency and sample integrity. Furthermore, the macromolecule permeability of PACT- and PARS-processed tissue hybrids supports the diffusion of immunolabels throughout intact tissue, whereas RIMS (refractive index matching solution) grants high-resolution imaging at depth by further reducing light scattering in cleared and uncleared samples alike. These methods are adaptable to difficult-to-image tissues, such as bone (PACT-deCAL), and to magnified single-cell visualization (ePACT). Together, these protocols and solutions enable phenotyping of subcellular components and tracing cellular connectivity in intact biological networks.


Figures
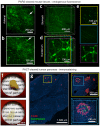
Figure 1
Figure 1
Applications of whole-organ and whole-organism clearing protocols. (ae) PARS-based whole-body clearing for assessing cellular-level adeno-associated virus (AAV) tropism (Supplementary Methods). Three weeks after systemic injection of AAV9:CAG-GFP, mice were PARS-cleared and their organs were excised and sectioned for imaging. (a,b) Projection images show GFP+ transduced cells in the adrenal gland. Arrow highlights a GFP+ cell near the surface of the adrenal gland with neuronal morphology, which is shown in higher magnification in b. (c) Projection images show GFP+ cells in the stomach from the surface to the lumen. GFP expression is particularly high in the myenteric plexus. (d,e) AAV9 transduces cells in several layers within the intestine (duodenum). (d) Projection image of GFP fluorescence. Double colored lines correspond to the positions of 50-μm maximum projection images extracted from the data set and presented in e. (e) GFP+ cells in the intestinal crypt (top), submucosal plexus (middle) and myenteric plexus (bottom). (f,g) Islet distribution within human pancreatic tissue. (f) A 2-mm-thick section of an adult human pancreas (top) was rendered transparent (bottom) with the PACT method. Briefly, a 2-mm-thick section was cut from a 4% PFA-fixed human pancreas, incubated in 0.5% PFA and 4% (wt/vol) acrylamide at 4 °C overnight and then polymerized in fresh A4P0 hydrogel monomer with 0.25% VA-044 thermal initiator for 2 h at 37 °C. The tissue was cleared with 4% SDS-PBS (pH 7.5) for 48 h, immunostained and mounted in sRIMS (~50% (wt/vol) sorbitol in 0.02 M PB, RI of 1.44). (g) The islet distribution was visualized by immunostaining for insulin (red), somatostatin (green) and DAPI (cyan) (see Table 4 for details on antibodies and nuclear stain); panels represent an imaging stack of 70 μm. Magnified regions are designated by yellow and blue boxes. Sparsely distributed islets are easily located with only 5× magnification (left). A group of islets were identified at 10× magnification (right, top), and a 3D image of a single islet was captured with a 25× magnification (right, bottom). All images were collected on a Zeiss LSM 780 confocal microscope with the Fluar 5× 0.25 NA M27 air objective (w.d. 12.5 mm), Plan-Apochromat 10× 0.45 NA M27 air objective (w.d. 2.0 mm) and the LD LCI Plan-Apochromat 25× 0.8 NA Imm Corr DIC M27 multi-immersion objective (w.d. 0.57 mm). Experiments on vertebrates conformed to all relevant governmental and institutional regulations, and they were approved by the Institutional Animal Care and Use Committee (IACUC) and by the Office of Laboratory Animal Resources at the California Institute of Technology.
Figure 2
Figure 2
PACT setup and procedure. To successfully hybridize tissue with hydrogel monomers via free-radical polymerization, the sample and hydrogel solution must be incubated at 37 °C in an oxygen-depleted environment. This is best accomplished within an airtight container that permits sample degassing. (a) Supplies for PACT chamber (left): 50-ml conical tube (large sample) or Vacutainer (small sample), size 7 stoppers that fit the 50-ml conical tube, PTFE tubing, needles, syringes and a razor blade or scissors to cut the syringe in half. Construct a degassing line that will allow a sample tube to be evacuated of oxygen using the house vacuum and then be placed under inert nitrogen atmosphere (a, left to right). (b) The PACT procedure for sample degassing and hydrogel polymerization is as follows (b, top row): prepare the hydrogel monomer solution, taking care to keep all reagents ice-cold; infuse the tissue sample with hydrogel monomer solution at 4 °C; insert the vacuum line needle into the stopper and place the container under house vacuum for 5–10 min; remove the vacuum line and insert both a venting needle and the hypodermic needle, which is connected to the nitrogen gas line tubing; bubble nitrogen gas through the sample and solution for 5–10 min, ensuring that the venting needle allows excess pressure to escape from the PACT container; and quickly remove both needles and place the sample and container in a 37 °C water bath for 1–3 h. (b, bottom row) Once the hydrogel has polymerized, pour off excess hydrogel, rinse the sample with 1× PBS and/or tissue off with a Kimwipe, section the sample (optional) and place the sample into a 50-ml conical tube filled with 8% (wt/vol) SDS clearing buffer. Incubate the sample at 37 °C in a shaking water bath until the sample is clear. Thoroughly wash the cleared sample, immunostain (optional) and then incubate the sample in RIMS to improve its optical clarity.
Figure 3
Figure 3
PACT protein loss and tissue expansion for different hydrogel and clearing conditions. A detailed comparison of the protein loss and tissue expansion for eight different hydrogel matrix compositions: A4P0, A4P1, A4P2, A4P4, A4P0B0.05, A4P4B0.05, A2P0B0.025 and unhybridized, and four different clearing buffers: 8% SDS-PBS (pH 7.5), 8% SDS-PBS (pH 8.5), 8% SDS-BB (pH 8.5) and 8% SDS in 0.1 M PB (pH 7.4). Perfused and fixed mouse brains were sliced into 1-mm-thick coronal slices, and combinations of all the different hydrogel and clearing conditions were performed on slices from comparable locations. Slices were monitored and imaged every 12 h, and the clearing buffer was collected for protein loss measurements and replaced. (a) Total protein content within each sample of clearing buffer collected throughout the clearing process was measured by the bicinchoninic acid assay by extrapolating the concentration of protein from a standard curve of BSA concentration in each clearing buffer (Supplementary Fig. 2a). Protein amounts from each time point were summed until each slice was completely clear, resulting in a measure for the total amount of protein lost while clearing for each slice. This total protein loss was then compared with the initial weight of each slice (n = 3). A comparison was also made with the protein loss of 100-μm-thick slices that were not cleared, but were permeabilized with PBST overnight (n = 9). (b) Comparison between total width and height tissue expansion between hydrogel compositions (n = 4). (c) Tissue expansion comparisons with different clearing conditions (n = 8). (ac) Data are presented as mean ± s.e.m. Experiments on vertebrates conformed to all relevant governmental and institutional regulations, and they were approved by the Institutional Animal Care and Use Committee (IACUC) and by the Office of Laboratory Animal Resources at the California Institute of Technology.
Figure 4
Figure 4
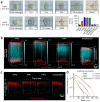
Clearing time course and antibody penetration of PACT-processed samples. Quantitative comparison of the effect of different hydrogel-embedding conditions and clearing buffers on time to clear and antibody penetration during immunostaining. 1-mm-thick mouse coronal slices were hybridized and cleared with the array of previously used PACT conditions (Fig. 3). Slices were monitored for the time they took to become transparent. Once cleared, slices were washed and then immunostained. (a) Representative images of two 1-mm-thick coronal brain slices (~1.0–0.0 mm anterior to bregma) through the time course for PACT clearing and a comparison of time to clear (mean ± s.e.m.) for each PACT hydrogel composition. For the representative images, slices were cleared with 8% SDS-PBS (pH 8.5) and incubated in RIMS for 24 h. (b) Imaging of antibody penetration through different PACT tissue preparations. Previously cleared and washed 1-mm-thick slices were immunostained for parvalbumin (red) and nuclei stained with DAPI (cyan), using 2-d incubations with the primary and Fab format secondary antibodies (for immunostaining reagents, see Table 4), transferred to RIMS for 5 h and then RIMS-mounted. Samples from the cortex, traversing the depth of the slice, were imaged on a Zeiss LSM 780 confocal microscope with a Plan-Apochromat 10× 0.45 NA M27 air objective (w.d. 2.0 mm). To ensure even illumination throughout the depth of the slice for fair antibody detection, we applied laser power z-correction (Zen software, Zeiss): power was changed linearly for each slice, shown as a gradient next to each image; starting power values at the top were chosen to match the level of fluorescence at the surface across slices, whereas the range of powers varied for different PACT conditions. Shown are images of staining through A4P0, A4P1 and A4P4 hydrogel-embedded samples, as well as unhybridized tissue, cleared with 8% SDS-PBS (pH 7.5). As antibody and small-molecule dye diffused through both the top and bottom surfaces of the slice simultaneously, the images show that within 2 d DAPI has fully penetrated in all of the conditions, whereas antibody labeling has progressed to varying extents, depending on the PACT condition. As slices cleared with the different conditions also swell to different extents during the process (indicated by their difference in height relative to the pre-clearing height of 1 mm, as indicated by the white dotted lines in b), penetration of antibody through a more swollen sample will either require longer diffusion time or faster diffusion rate to reach an equivalent anatomical depth as in a less swollen sample. Incomplete detection of the DAPI signal in A4P1 and A4P4 slices is due to the difficulty of achieving similar light penetration in highly cross-linked slices. (c) Depiction of parvalbumin staining through same slices as in b. DAPI signal has been removed to better show the variable penetration of the antibody over the course of a 2-d period. (d) Quantification of antibody penetration through PACT conditions depicted in b and c. Antibody fluorescence signal was scaled by the average DAPI intensity for each z-section inside the volume and the average scaled fluorescence along a line perpendicular to the tissue surface produced a final estimate of labeling intensity (in arbitrary units, a.u.) as a function of tissue depth (Supplementary Methods). Antibody diffusion was fit to an exponential model [f(x) = a × exp (−tau × x) + b], with the exponent tau being inversely proportional to the square root of the diffusivity, wherein a larger tau indicates slower diffusion. Labeling intensities for A4P0, A4P1, A4P4 and unhybridized samples cleared with 8% SDS-PBS (pH 7.5), as a representative sample of all the different buffers, are plotted on a logarithmic scale. The amount of PFA contained in the hydrogel-tissue matrix is inversely proportional to immunohistochemical staining efficiency. Experiments on vertebrates conformed to all relevant governmental and institutional regulations, and they were approved by the Institutional Animal Care and Use Committee (IACUC) and by the Office of Laboratory Animal Resources at the California Institute of Technology.
Figure 5
Figure 5
Preservation of tissue architecture during delipidation. The differential effects of individual clearing conditions on cellular architecture and endogenous and stained fluorescence imaging. (a–c) Mice that received bilateral intracranial injections in the lateral septum of AAV expressing the tdTomato transgene were perfusion-fixed with 4% PFA, and a subset of 1-mm-thick unhybridized coronal brain sections were prepared for microscopy without clearing (control, first column), or they were first rendered transparent via the CUBIC method, (second column). The second subset of 1-mm-thick sections underwent PACT-processing: A4P0 embedding (third column) or A4P4 embedding (fourth column) and clearing with 8% SDS-PBS (pH 7.5), followed by preparation for ultrastructural study or RIMS mounting. (a) Brain sections were photographed after fixation (control) or immediately after clearing (CUBIC, A4P0 and A4P4) to illustrate the degree of tissue swelling that occurred for each condition. (b) Control (unhybridized, uncleared), CUBIC-cleared and PACT-cleared (A4P0, A4P4) tissues were then processed identically for ultrastructural examination using electron microscopy and tomography (Supplementary Methods). Overviews (top row) from each of the four samples illustrate the relative amount of lipid loss attributable to the different clearing methods, in terms of contrast between structures. Tomographic reconstruction (bottom row) of subregions of the overviews, each showing a portion of an axon and surrounding cellular structures, indicates the extent of change at the fine-structural level. (c) Control, PACT- and CUBIC-cleared brain sections were mounted in RIMS or CUBIC reagent-2 (refs. 11,21), respectively, and the endogenous expression of tdTomato was imaged on a Zeiss LSM 780 confocal microscope with the LD LCI Plan-Apochromat 25× 0.8 NA Imm Corr DIC M27 multi-immersion objective (w.d. 0.57 mm). Volume renderings (top: x,y,z = 300 μm for PACT- and CUBIC-cleared samples and x,y,z = 300, 300, 140 μm for control) and maximum intensity projections (bottom: x,y,z = 100,100,50 μm) are shown. In all images except the uncleared control, cells are visualized throughout the volume imaged. In the control image, light is unable to penetrate through the sample to image at depth. (d) Preservation of myelin proteins. 200-μm-thick A4P0-PACT-cleared mouse brain sections and 50-μm-thick uncleared sections were immunostained for SMI-312 and for myelin basic protein (MBP), using Atto 488–conjugated and Atto 647N–conjugated Fab format secondaries (see Table 4 for details). After a 2-h RIMS incubation, the transparent sections were mounted and imaged on a Zeiss LSM 780 confocal microscope with the Plan-Apochromat 10× 0.45 NA M27 air objective (w.d. 2.0 mm) and the LD LCI Plan-Apochromat 25× 0.8 NA Imm Corr DIC M27 multi-immersion objective (w.d. 0.57 mm). The images correspond to a 50-μm-thick maximum intensity projection over the dentate gyrus; Top: A4P0-PACT cleared, Bottom: uncleared smaller panels are high-magnification images of the boxed areas showing myelinated axons. Experiments on vertebrates conformed to all relevant governmental and institutional regulations, and they were approved by the Institutional Animal Care and Use Committee (IACUC) and by the Office of Laboratory Animal Resources at the California Institute of Technology.
Figure 6
Figure 6
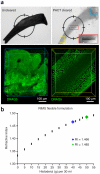
PACT-deCAL and optimized RIMS formulation for imaging decalcified bone samples. (a) After perfusion fixation with 4% PFA, the right and left tibia bones were dissected and postfixed in 4% PFA overnight. One tibia was reserved as the uncleared control (top left), whereas the other tibia bone was A4P0-embedded and cleared (top right) according to PACT-deCAL, as follows. The tibia bone was first cleared in 8% SDS-PBS (pH 8) for 24 h, and then it was transferred into 0.1 M EDTA for 2 d and finally cleared further in 8% SDS-PBS (pH 8) for 2 d at 37 °C. The cleared bone was washed in 1× PBS three times over 1 d and incubated in PBS containing 1:200 DRAQ5 for 2 d at 37 °C. The stained bone was quickly rinsed in 1× PBS and incubated in 1.49 RIMS overnight at 37 °C. The bright-field image (top right) depicts the resulting bone transparency via the placement of a ruler (small red box) underneath the tibia, wherein the tibia's outline on top of the ruler can be seen in the magnified inset of the ruler (large red box). The cleared tibia was imaged in two regions (yellow and blue boxes) on a Zeiss LSM 780 confocal microscope with the LD LCI Plan-Apochromat 25× 0.8 NA Imm Corr DIC M27 multi-immersion objective (w.d. 0.57 mm). (b) RIMS may be formulated with different concentrations of Histodenz in order to achieve an RI that aligns with the tissue density and light-scattering properties of the sample to be imaged, as well as to the optical properties of the imaging setup (objective lens with or without immersion medium). RIMS with an RI ~1.47 is well suited for most cleared soft tissues (blue tick mark), whereas cleared bones should be incubated in RIMS with RI ~1.48–1.49 (green tick mark). Rodent husbandry and euthanasia conformed to all relevant governmental and institutional regulations; animal protocols were approved by the Institutional Animal Care and Use Committee (IACUC) and by the Office of Laboratory Animal Resources at the California Institute of Technology.
Figure 7
Figure 7
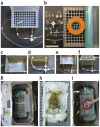
Assembling and working with the PARS chamber. (a) A completed PARS chamber used for whole-body tissue clearing. (b) Individual parts to build a PARS chamber: (1) three 1/8 × 1/8-inch barbed connectors, (2) two 3/32-inch barbed male Luers with locking nut, (3) a 1,000 μl pipette tip box, (4) a 1-gallon Ziploc freezer bag, (5) a three-way stopcock with Luer lock, (6) a 3/32-inch barbed female Luer with full tread, (7) a roll of lab tape, (8) a 22-G × 1-inch gavage needle, (9) a 1/8-inch barbed male slip Luer, (10) a female Luer tee with locks, (11) clay and (12) Tygon E-lab tubing. Ruler shown is 5 cm in length. (c) Three 1/8-inch holes are drilled into the pipette tip box: two into the box front and one into its side, all ~2 cm below the top rim of the box. The three 1/8 × 1/8-inch barbed connectors are placed into the drilled holes. To connect the outflow line (blue tape bands on outflow line tubing), a piece of Tygon tubing is connected from the bottom inside of the pipette box to the single 1/8-inch barbed connector that was inserted through the box side. (d) To continue the outflow line, a second, longer piece of blue-taped tubing is attached to the outer fitting of this same barbed connector (on the outside of the pipette tip box side), and then the other end of this tubing is threaded through the peristaltic pump, pulled back over toward the pipette box and finally connected to a three-way stopcock with a 3/32-inch barbed male Luer with locking nut (rightmost blue-banded tubing in d). To form the inflow line, a short length of tubing (green tape band) is used to connect the three-way stopcock to the front right 1/8-inch barbed connector of the pipette box. The solute flushing line and nitrogen bubbling line, which are subserved by the same tubing (white tape band), are formed by another short length of tubing that joins the third port of the stopcock to the front left 1/8-inch barbed connector. (e) The inflow line is continued inside the pipette box, with the tubing coiled several times around the base of the box so that the solute will be reheated before it passes through the feeding gavage into the subject. The solute flushing line and nitrogen bubbling line is continued inside the pipette tip box and taped to the bottom of the chamber (not shown). (f) The tip of the coiled inflow line tubing is threaded up through the tip wafer (see bird's-eye view of threaded wafer in a) and connected to a 22-G ×1-inch gavage needle with a 1/8-inch barbed male slip Luer. The gavage needle is secured with a short loop of Tygon tubing (~90 mm) threaded through two holes of the wafer. (g) During the polymerization step, the chamber is placed into a 37 °C water bath and sealed in a Ziploc bag. The tubing is attached to the chamber with three 1/8 × 1/8-inch barbed connectors punctured through the Ziploc bag. The Tygon tubing is reconnected from the outside of the bag and surrounded with clay to make an airtight seal. (h) The animal is placed onto the pipette tip box, and the 22-G × 1-inch gavage needle is used to catheterize the heart. (i) The chamber is placed into a 37 °C water bath. A female Luer tee, which is taped onto the lid of the pipette tip box, is punctured through the Ziploc bag, and this joint is sealed with clay to ensure an airtight seal. Finally, to accelerate polymerization, a vacuum line is connected to the female Luer tee to remove oxygen (orange arrow), and a nitrogen gas line (white arrow) is connected to the 1/8-inch barbed connector to deliver a steady flow of nitrogen into the bagged system. The solute is continually circulated through the animal from the outflow line (blue arrow, which also indicates the direction of flow through blue-taped tubing) and inflow line (green arrow, which also indicates the direction of flow through green-taped tubing).
Figure 8
Figure 8
Whole-body clearing of mice with PARS. (a) A4P0-hybridized organs shown before the start of clearing (left) and after 5 d of clearing with 8% SDS-PBS (pH 8.5) and overnight washing with 1× PBS at pH 7.5 (right). Numbers correspond to the extracted organs in b. (b) Extracted organs from the cleared mouse in a, pictured before (top) and after (bottom) RIMS incubation for 3 d. Black pointers correspond to the adrenal gland on the kidney and to the ovaries on the fallopian tubes. Each square represents 0.5 cm2. Rodent husbandry and euthanasia conformed to all relevant governmental and institutional regulations; animal protocols were approved by the Institutional Animal Care and Use Committee (IACUC) and by the Office of Laboratory Animal Resources at the California Institute of Technology.
Figure 9
Figure 9
Light-sheet microscopy enables fast and high-resolution imaging of cleared samples. (a) A schematic diagram of the light-sheet microscope; M, mirror; DM, dichroic mirror; S, sample; EF, emission filter. The scientific CMOS camera (Zyla 4.2 sCMOS, Andor) is running in a light-sheet mode, in which the readout direction of the camera is unidirectional and synchronized with the scanning direction and speed of the light source. In this configuration, only the pixels that are illuminated will be recorded, thus improving the signal to noise ratio of the image. For ease of synchronization, the function generator, the camera and the oscilloscope are controlled using a custom MATLAB program. (b) An image of the 3D-printed immersion chamber (see design in Supplementary Data 1), in which the CLARITY objective (Olympus 25× 1.0 NA multi-immersion objective, w.d. 8.0 mm) is immersed in glycerol, whereas the sample is within a quartz cuvette filled with RIMS. (c) A volume rendering (Imaris, Bitplane) and cross-sections at different depths of a cleared Thy1-YFP mouse brain section (1 mm thick), taken with the light-sheet microscope. The intensity of the layers was normalized as per Imaris image processing function, i.e., the mean and s.d. of each layer were equalized to the mean and s.d. of the entire stack using linear transformation. The images were acquired at 45 frames per second (voxel size: 0.117 μm × 0.117 μm × 0.25 μm, bit depth: 12). The cross-sections at different depths, which are perpendicular to the scan direction, are maximum intensity projections (Imaris) across a 5-μm volume. A parts list for this setup is available in Supplementary Table 1.
Figure 10
Figure 10
Two different workflows for cell tracing in neuTube and Imaris. (a) Tracing using neuTube. (b) Tracing using Imaris 7.1 (Bitplane). Results shown here took 25 min for a novice user with ~5 h of total experience using each tracing tool. Total tracing time to achieve similar results was generally comparable, but we found neuTube to be more efficient for quickly tracing isolated neurites. (a) neuTube 3D visualization (i), neuTube semiautomated tracing result (ii), tracing error (iii), and manual correction (iv). (b) Imaris ROI selection (i), Imaris `Autopath' seeding (ii), manual correction of tracing error (iii), and trace extension using `Autopath' (iv). The original test mage on which semiautomated tracing was performed is provided in Supplementary Data 3.

Similar articles

Cited by

References

    1. Chen TW, et al. Ultrasensitive fluorescent proteins for imaging neuronal activity. Nature. 2013;499:295–300. - PMC - PubMed
    1. Akerboom J, et al. Optimization of a GCaMP calcium indicator for neural activity imaging. J. Neurosci. 2012;32:13819–13840. - PMC - PubMed
    1. Peters AJ, Chen SX, Komiyama T. Emergence of reproducible spatiotemporal activity during motor learning. Nature. 2014;510:263–267. - PubMed
    1. White RM, et al. Transparent adult zebrafish as a tool for in vivo transplantation analysis. Cell Stem Cell. 2008;2:183–189. - PMC - PubMed
    1. Kaletta T, Hengartner MO. Finding function in novel targets: C. Elegans as a model organism. Nat. Rev. Drug Discov. 2006;5:387–399. - PubMed

Publication types