. 2015 Dec 15;26(25):4686-99.
doi: 10.1091/mbc.E15-08-0599. Epub 2015 Oct 21.

CARTS biogenesis requires VAP-lipid transfer protein complexes functioning at the endoplasmic reticulum-Golgi interface

Affiliations

CARTS biogenesis requires VAP-lipid transfer protein complexes functioning at the endoplasmic reticulum-Golgi interface

Yuichi Wakana et al. Mol Biol Cell. .

Abstract

Vesicle-associated membrane protein-associated protein (VAP) is an endoplasmic reticulum (ER)-resident integral membrane protein that controls a nonvesicular mode of ceramide and cholesterol transfer from the ER to the Golgi complex by interacting with ceramide transfer protein and oxysterol-binding protein (OSBP), respectively. We report that VAP and its interacting proteins are required for the processing and secretion of pancreatic adenocarcinoma up-regulated factor, whose transport from the trans-Golgi network (TGN) to the cell surface is mediated by transport carriers called "carriers of the trans-Golgi network to the cell surface" (CARTS). In VAP-depleted cells, diacylglycerol level at the TGN was decreased and CARTS formation was impaired. We found that VAP forms a complex with not only OSBP but also Sac1 phosphoinositide phosphatase at specialized ER subdomains that are closely apposed to the trans-Golgi/TGN, most likely reflecting membrane contact sites. Immobilization of ER-Golgi contacts dramatically reduced CARTS production, indicating that association-dissociation dynamics of the two membranes are important. On the basis of these findings, we propose that the ER-Golgi contacts play a pivotal role in lipid metabolism to control the biogenesis of transport carriers from the TGN.


Figures

FIGURE 1:
FIGURE 1:
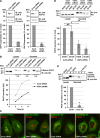
VAP-A/B knockdown inhibits the processing and secretion of PAUF. (A–D) HeLa cells were transfected with control (Cont) siRNA or a mixture of siRNA oligos specific for VAP-A (523) and VAP-B (498). (A) At 72 h after siRNA transfection, the cell lysates were collected and Western blotted with the indicated antibodies. Calnexin was used as a marker to monitor the amount of proteins loaded. The graphs show quantification of the expression levels of VAPs. The average values of four independent experiments are shown (mean ± SD). (B and D) At 48 h after siRNA transfection, the cells were transfected with a plasmid for PAUF-MycHis. (B) After 20 h, the cells were washed and incubated with fresh medium, and a portion of medium was collected at the indicated time points. (D) The cells were pretreated with ethanol (EtOH) or 2 μg/ml 25-OH for 2.5 h and further incubated with fresh medium containing each reagent for 3 h. The medium and the cell lysate were Western blotted with an anti-His antibody. Asterisk in B denotes the immature form of PAUF. The graphs show quantification of PAUF secretion. The amount of secreted PAUF was normalized with the total cellular levels. The average values of three independent experiments are shown in the graph in D (mean ± SD). Single and double asterisks in D indicate p < 0.05 and p < 0.01, respectively. (C) At 48 h after siRNA transfection, the cells were transfected with a plasmid for GST-C1a-PKD1 or GST-PKD2 wild type (WT). After 20 h, the cells were fixed and visualized with anti-GST and anti-TGN46 antibodies. Scale bar: 10 μm. (E) HeLa cells were transfected with a plasmid for PAUF-MycHis. After 20 h, the cells were pretreated with ethanol (control) or 5 μM d-ceramide-C6 (d-Cer-C6) for 2.5 h and further incubated with fresh medium containing each reagent for 3 h. Western blotting and quantification were performed as in D. Asterisk indicates p < 0.0005.
FIGURE 2:
FIGURE 2:
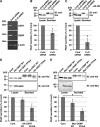
Disruption of the functions of CERT and OSBP inhibits the processing and secretion of PAUF. (A–C) HeLa cells were transfected with control (Cont) siRNA or a mixture of siRNA oligos specific for CERT and OSBP (C+O siRNA). (A) At 72 h after siRNA transfection, RNA was prepared from the cells, and the knockdown efficiency was monitored by RT-PCR with specific primers for CERT, OSBP, or β-actin. (B and C) At 48 h after siRNA transfection, the cells were transfected with a plasmid for PAUF-MycHis. (B) After 20 h, the cells were washed and incubated with fresh medium for 6 h. (C) The cells were pretreated with 2 μg/ml 25-OH for 2.5 h and further incubated with fresh medium containing 25-OH for 3 h. Western blotting and quantification were performed as in Figure 1D. The average values of three and five independent experiments are shown in the graphs in B and C, respectively (mean ± SD). Asterisks indicate p < 0.02 (B) and p < 0.005 (C). (D and E) HEK 293T cells were transfected with a PAUF-MycHis plasmid alone (Cont) or with a PAUF-MycHis plasmid in combination with a plasmid for the wild type (WT) or the FF/AA mutant of HA-CERT (D) or Myc-OSBP (E). After 20 h, the cells were washed and incubated with fresh medium for 4 h. The medium and the cell lysate were Western blotted with the indicated antibodies. Quantification was performed as in Figure 1D. Asterisk in D denotes a nonspecific polypeptide, and asterisk in E indicates p < 0.02.
FIGURE 3:
FIGURE 3:
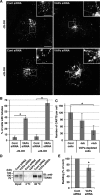
VAP-A/B knockdown inhibits the biogenesis of CARTS from the TGN. (A–C) HeLa cells stably expressing PAUF-MycHis were transfected with control (Cont) siRNA or a mixture of siRNA oligos specific for VAP-A (523) and VAP-B (498). After 72 h, the cells were treated with or without 2 μg/ml 25-OH for 2.5 h, fixed, and visualized with an anti-Myc antibody. High magnifications of the boxed areas are shown in the insets. Scale bars: 10 μm (large panels); 4 μm (insets). (B) Quantification of the formation of PAUF-MycHis–containing tubules. The percentage of control and VAP-A/B knockdown cells with PAUF-MycHis–containing tubules in the presence or absence of 25-OH (n = 102–123 cells per condition) was determined, and the average values of four independent experiments are shown (mean ± SD). Asterisks indicate p < 0.0001. (C) Quantification of PAUF-MycHis–containing CARTS. The number of CARTS in 25-OH–treated control cells (n = 1208 punctate elements in 10 cells) and VAP-A/B-depleted cells with or without large tubules (tub) (n = 432 and 850 punctate elements in 10 cells, respectively) was determined (mean ± SD). Asterisk indicates p < 0.0001. (D and E) HeLa cells were transfected with control siRNA or a mixture of siRNA oligos specific for VAP-A (523) and VAP-B (498). At 72 h after siRNA transfection, the cells were treated with 2 μg/ml 25-OH for 2.5 h and subjected to CARTS formation assay as described in Materials and Methods. The pellet produced with high-speed centrifugation and containing CARTS was Western blotted with an anti-TGN46 antibody. The input refers to permeabilized HeLa cells used as starting material in these experiments. (E) Quantification of CARTS formation. The average values of four experiments are shown (mean ± SD). Asterisk indicates p < 0.03.
FIGURE 4:
FIGURE 4:
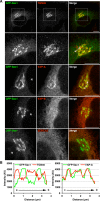
Colocalization of VAPs with Sac1 at juxtanuclear compartments closely apposed to the TGN. (A and B) HeLa cells stably expressing GFP-Sac1 were treated with 2 μg/ml 25-OH for 1 h, fixed, and visualized with GFP and an antibody against TGN46, VAP-A, VAP-B, or SERCA2. High magnifications of the boxed areas are shown in the lower panels. N, nucleus. Scale bars: 10 μm. (B) Distribution of GFP-Sac1 and TGN46 (left graph) or VAP-A (right graph) in the perinuclear region. The fluorescence intensity of GFP-Sac1 and TGN46 or VAP-A along a blue line in the respective merged images is shown.
FIGURE 5:
FIGURE 5:
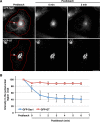
Sac1-positive juxtanuclear compartments are associated with the ER membrane. (A) HeLa cells stably expressing GFP-Sac1 or GFP-GT were subjected to fluorescence loss in photobleaching. The areas marked by a red line were bleached as described in Materials and Methods. Scale bar: 10 μm. (B) Quantification of the fluorescence intensity of GFP-Sac1 and GFP-GT in the juxtanuclear region. The average values of the fluorescence intensity of three cells at the indicated time points are shown (mean ± SD).
FIGURE 6:
FIGURE 6:
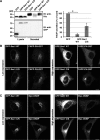
Interaction and colocalization of Sac1 with VAPs and OSBP at juxtanuclear ER subdomains. (A) HEK 293T cells were transfected with a plasmid for FLAG-Sac1 or the FLAG vector; 20 h later, the cells were treated with ethanol or 4 μg/ml 25-OH for 2.5 h. The cell lysates were subjected to immunoprecipitation with anti-FLAG beads. The cell lysates (input) and immunoprecipitates were Western blotted with the indicated antibodies. The single and double asterisks denote immunoglobulin heavy chain and a nonspecific polypeptide, respectively. (B) Lysates of HEK 293T cells transfected with plasmids for FLAG-Sac1 and Myc-OSBP wild type (WT) or FF/AA or the Myc vector were subjected to immunoprecipitation with anti-FLAG beads. Asterisk denotes immunoglobulin heavy chain. (C) Lysates of HEK 293T cells transfected with plasmids for FLAG-Sac1 and HA-CERT or the HA vector were subjected to immunoprecipitation with anti-FLAG beads. Asterisk denotes immunoglobulin heavy chain. (D) HeLa cells were cotransfected with plasmids for GFP-Sac1 and Myc-OSBP, fixed, and visualized with GFP and antibodies against Myc and VAP-A or VAP-B. N, nucleus. Scale bar: 10 μm. (E) HeLa cells stably expressing GFP-Sac1 were transfected with a plasmid for Myc-OSBP (top row). For the experiment with GFP-Sac1 C/S (bottom row), HeLa cells were cotransfected with plasmids for GFP-Sac1 C/S and Myc-OSBP. The cells were fixed and subjected to PLA with antibodies against VAP-A and Myc. High magnifications of the boxed areas are shown in the insets. Scale bars: 10 μm (large panels); 5 μm (insets).
FIGURE 7:
FIGURE 7:
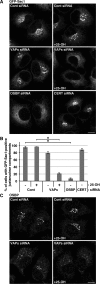
Knockdown of VAP-A/B and OSBP inhibits juxtanuclear accumulations of Sac1. (A–C) HeLa cells stably expressing GFP-Sac1 were transfected with control (Cont) siRNA, a mixture of siRNA oligos for VAP-A (523) and VAP-B (498), OSBP siRNA, or CERT siRNA. After 20 h, the cells were washed and incubated with fresh medium. At 72 h after siRNA transfection, the cells were treated with or without 2 μg/ml 25-OH for 2.5 h, fixed, and visualized with GFP (A) and an anti-OSBP antibody (C). Scale bars: 10 μm. (B) Quantification of Sac1 accumulations at juxtanuclear ER subdomains. The percentage of control, VAP-A/B, OSBP, and CERT knockdown cells with GFP-Sac1–positive juxtanuclear compartments (n = 202–250 cells per condition) in the presence or absence of 25-OH was determined, and the average values of three independent experiments are shown (mean ± SD). Asterisks indicate p < 0.0001.
FIGURE 8:
FIGURE 8:
Overexpression of Sac1 inhibits PAUF processing and secretion in a phosphatase activity–dependent manner. (A) HEK 293T cells were cotransfected with plasmids for PAUF-MycHis and GFP (control) or GFP-Sac1 wild type (WT) or C/S. After 20 h, the cells were washed and incubated with fresh medium for 4 h. The medium and the cell lysate were Western blotted with the indicated antibodies. The amount of secreted PAUF was normalized with the total cellular levels. The average values of four independent experiments are shown (mean ± SD). Asterisk indicates p < 0.02. (B and C) HeLa cells were cotransfected with a plasmid for FAPP-PH-GST (B) or Myc-OSBP (C) in combination with a plasmid for GFP-Sac1 wild type or C/S, fixed, and visualized with GFP and an antibody against GST or Myc. Scale bars: 10 μm.
FIGURE 9:
FIGURE 9:
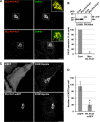
Immobilization of ER–Golgi contacts impairs PAUF secretion and CARTS biogenesis. (A) HeLa cells were transfected with a plasmid for Myc-PH-FFAT, fixed, and visualized with antibodies against Myc and VAP-A or VAP-B. High magnifications of merged images of the boxed areas are shown in the insets. Scale bars: 10 μm (large panels); 5 μm (insets). (B) HEK 293T cells were transfected with a PAUF-MycHis plasmid alone (control) or with a PAUF-MycHis plasmid in combination with a plasmid for Myc-PH-FFAT. After 20 h, the cells were washed and incubated with fresh medium for 4 h. Western blotting and quantification were performed as in Figure 1D. Asterisk indicates p < 0.04. (C) HeLa cells stably expressing PAUF-MycHis were transfected with a plasmid for mRFP (control) or PH-FFAT-mRFP, fixed, and visualized with mRFP and an anti-Myc antibody. Scale bar: 10 μm. (D) Quantification of PAUF-MycHis–containing CARTS. The number of CARTS in mRFP-expressing cells (n = 1128 punctate elements in 10 cells) and PH-FFAT-mRFP-expressing cells (n = 289 punctate elements in 10 cells) was determined (mean ± SD). Asterisk indicates p < 0.0001.
FIGURE 10:
FIGURE 10:
Working model for ER–Golgi contact-mediated regulation of transport carrier biogenesis. Ceramide (Cer) and cholesterol (Chol) are transported from the ER to the trans-Golgi/TGN by VAP-CERT and VAP-OSBP-Sac1 complexes, respectively, at the membrane contact site. CARTS biogenesis is controlled in two ways: 1) DAG-dependent recruitment of PKD and 2) cholesterol- and SM-rich microdomain organization. PI4P transported from the trans-Golgi/TGN to the ER is hydrolyzed by Sac1, which is recruited to a VAP-OSBP complex formed at a specialized ER subdomain closely apposed to the trans-Golgi/TGN. Reagents used in this study are also shown: 25-OH treatment inhibits both cholesterol synthesis and transfer; d-ceramide-C6 (d-Cer-C6) treatment disrupts cholesterol- and SM-rich microdomain organization.

Similar articles

Cited by

References

    1. Alpy F, Rousseau A, Schwab Y, Legueux F, Stoll I, Wendling C, Spiegelhalter C, Kessler P, Mathelin C, Rio MC, et al. STARD3 or STARD3NL and VAP form a novel molecular tether between late endosomes and the ER. J Cell Sci. 2013;126:5500–5512. - PubMed
    1. Balch WE, Glick BS, Rothman JE. Sequential intermediates in the pathway of intercompartmental transport in a cell-free system. Cell. 1984;39:525–536. - PubMed
    1. Banerji S, Ngo M, Lane CF, Robinson CA, Minogue S, Ridgway ND. Oxysterol binding protein-dependent activation of sphingomyelin synthesis in the Golgi apparatus requires phosphatidylinositol 4-kinase IIα. Mol Biol Cell. 2010;21:4141–4150. - PMC - PubMed
    1. Bankaitis VA, Garcia-Mata R, Mousley CJ. Golgi membrane dynamics and lipid metabolism. Curr Biol. 2012;22:R414–R424. - PMC - PubMed
    1. Baron CL, Malhotra V. Role of diacylglycerol in PKD recruitment to the TGN and protein transport to the plasma membrane. Science. 2002;295:325–328. - PubMed

Publication types

MeSH terms

LinkOut - more resources