Characterizing noise structure in single-cell RNA-seq distinguishes genuine from technical stochastic allelic expression
- PMID: 26489834
- PMCID: PMC4627577
- DOI: 10.1038/ncomms9687
Characterizing noise structure in single-cell RNA-seq distinguishes genuine from technical stochastic allelic expression
Erratum in
-
Corrigendum: Characterizing noise structure in single-cell RNA-seq distinguishes genuine from technical stochastic allelic expression.Nat Commun. 2016 Jan 11;7:10415. doi: 10.1038/ncomms10415. Nat Commun. 2016. PMID: 26752026 Free PMC article. No abstract available.
Abstract
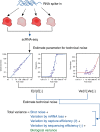
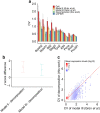
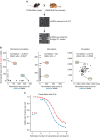
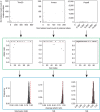
Single-cell RNA-sequencing (scRNA-seq) facilitates identification of new cell types and gene regulatory networks as well as dissection of the kinetics of gene expression and patterns of allele-specific expression. However, to facilitate such analyses, separating biological variability from the high level of technical noise that affects scRNA-seq protocols is vital. Here we describe and validate a generative statistical model that accurately quantifies technical noise with the help of external RNA spike-ins. Applying our approach to investigate stochastic allele-specific expression in individual cells, we demonstrate that a large fraction of stochastic allele-specific expression can be explained by technical noise, especially for lowly and moderately expressed genes: we predict that only 17.8% of stochastic allele-specific expression patterns are attributable to biological noise with the remainder due to technical noise.
Conflict of interest statement
The authors declare no competing financial interests.
Figures


Similar articles
-
Quality Control of Single-Cell RNA-seq.Methods Mol Biol. 2019;1935:1-9. doi: 10.1007/978-1-4939-9057-3_1. Methods Mol Biol. 2019. PMID: 30758816
-
Analysis of Technical and Biological Variability in Single-Cell RNA Sequencing.Methods Mol Biol. 2019;1935:25-43. doi: 10.1007/978-1-4939-9057-3_3. Methods Mol Biol. 2019. PMID: 30758818
-
Single-Cell Allele-Specific Gene Expression Analysis.Methods Mol Biol. 2019;1935:155-174. doi: 10.1007/978-1-4939-9057-3_11. Methods Mol Biol. 2019. PMID: 30758826
-
Computational methods for allele-specific expression in single cells.Trends Genet. 2024 Nov;40(11):939-949. doi: 10.1016/j.tig.2024.07.003. Epub 2024 Aug 10. Trends Genet. 2024. PMID: 39127549 Review.
-
Machine learning and statistical methods for clustering single-cell RNA-sequencing data.Brief Bioinform. 2020 Jul 15;21(4):1209-1223. doi: 10.1093/bib/bbz063. Brief Bioinform. 2020. PMID: 31243426 Review.
Cited by
-
BEARscc determines robustness of single-cell clusters using simulated technical replicates.Nat Commun. 2018 Mar 22;9(1):1187. doi: 10.1038/s41467-018-03608-y. Nat Commun. 2018. PMID: 29567991 Free PMC article.
-
Potential Clinical Application of Genomics in Multiple Myeloma.Int J Mol Sci. 2018 Jun 10;19(6):1721. doi: 10.3390/ijms19061721. Int J Mol Sci. 2018. PMID: 29890777 Free PMC article. Review.
-
VarID2 quantifies gene expression noise dynamics and unveils functional heterogeneity of ageing hematopoietic stem cells.Genome Biol. 2023 Jun 23;24(1):148. doi: 10.1186/s13059-023-02974-1. Genome Biol. 2023. PMID: 37353813 Free PMC article.
-
Studying stochastic systems biology of the cell with single-cell genomics data.bioRxiv [Preprint]. 2023 May 29:2023.05.17.541250. doi: 10.1101/2023.05.17.541250. bioRxiv. 2023. Update in: Cell Syst. 2023 Oct 18;14(10):822-843.e22. doi: 10.1016/j.cels.2023.08.004. PMID: 37292934 Free PMC article. Updated. Preprint.
-
Flexible comparison of batch correction methods for single-cell RNA-seq using BatchBench.Nucleic Acids Res. 2021 Apr 19;49(7):e42. doi: 10.1093/nar/gkab004. Nucleic Acids Res. 2021. PMID: 33524142 Free PMC article.
References
-
- Yan L. et al. Single-cell RNA-Seq profiling of human preimplantation embryos and embryonic stem cells. Nat. Struct. Mol. Biol. 20, 1131–1139 (2013). - PubMed
Publication types
MeSH terms
Substances
Grants and funding
LinkOut - more resources
Full Text Sources
Other Literature Sources
Molecular Biology Databases

