Harnessing Connectivity in a Large-Scale Small-Molecule Sensitivity Dataset
- PMID: 26482930
- PMCID: PMC4631646
- DOI: 10.1158/2159-8290.CD-15-0235
Harnessing Connectivity in a Large-Scale Small-Molecule Sensitivity Dataset
Abstract
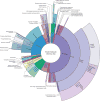
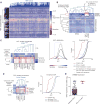
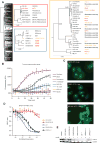
Identifying genetic alterations that prime a cancer cell to respond to a particular therapeutic agent can facilitate the development of precision cancer medicines. Cancer cell-line (CCL) profiling of small-molecule sensitivity has emerged as an unbiased method to assess the relationships between genetic or cellular features of CCLs and small-molecule response. Here, we developed annotated cluster multidimensional enrichment analysis to explore the associations between groups of small molecules and groups of CCLs in a new, quantitative sensitivity dataset. This analysis reveals insights into small-molecule mechanisms of action, and genomic features that associate with CCL response to small-molecule treatment. We are able to recapitulate known relationships between FDA-approved therapies and cancer dependencies and to uncover new relationships, including for KRAS-mutant cancers and neuroblastoma. To enable the cancer community to explore these data, and to generate novel hypotheses, we created an updated version of the Cancer Therapeutic Response Portal (CTRP v2).
Significance: We present the largest CCL sensitivity dataset yet available, and an analysis method integrating information from multiple CCLs and multiple small molecules to identify CCL response predictors robustly. We updated the CTRP to enable the cancer research community to leverage these data and analyses.
©2015 American Association for Cancer Research.
Conflict of interest statement
No potential conflicts of interest were disclosed.
Figures


Similar articles
-
Computational Analyses Connect Small-Molecule Sensitivity to Cellular Features Using Large Panels of Cancer Cell Lines.Methods Mol Biol. 2019;1888:233-254. doi: 10.1007/978-1-4939-8891-4_14. Methods Mol Biol. 2019. PMID: 30519951 Free PMC article.
-
An interactive resource to identify cancer genetic and lineage dependencies targeted by small molecules.Cell. 2013 Aug 29;154(5):1151-1161. doi: 10.1016/j.cell.2013.08.003. Cell. 2013. PMID: 23993102 Free PMC article.
-
Drug Repositioning for Cancer Therapy Based on Large-Scale Drug-Induced Transcriptional Signatures.PLoS One. 2016 Mar 8;11(3):e0150460. doi: 10.1371/journal.pone.0150460. eCollection 2016. PLoS One. 2016. PMID: 26954019 Free PMC article.
-
More than fishing for a cure: The promises and pitfalls of high throughput cancer cell line screens.Pharmacol Ther. 2018 Nov;191:178-189. doi: 10.1016/j.pharmthera.2018.06.014. Epub 2018 Jun 25. Pharmacol Ther. 2018. PMID: 29953899 Free PMC article. Review.
-
New tools for old drugs: Functional genetic screens to optimize current chemotherapy.Drug Resist Updat. 2018 Jan;36:30-46. doi: 10.1016/j.drup.2018.01.001. Epub 2018 Jan 12. Drug Resist Updat. 2018. PMID: 29499836 Free PMC article. Review.
Cited by
-
Differential Outcomes in Codon 12/13 and Codon 61 NRAS-Mutated Cancers in the Phase II NCI-MATCH Trial of Binimetinib in Patients with NRAS-Mutated Tumors.Clin Cancer Res. 2021 Jun 1;27(11):2996-3004. doi: 10.1158/1078-0432.CCR-21-0066. Epub 2021 Feb 26. Clin Cancer Res. 2021. PMID: 33637626 Free PMC article. Clinical Trial.
-
DeepDRA: Drug repurposing using multi-omics data integration with autoencoders.PLoS One. 2024 Jul 26;19(7):e0307649. doi: 10.1371/journal.pone.0307649. eCollection 2024. PLoS One. 2024. PMID: 39058696 Free PMC article.
-
Predicting tumor response to drugs based on gene-expression biomarkers of sensitivity learned from cancer cell lines.BMC Genomics. 2021 Apr 15;22(1):272. doi: 10.1186/s12864-021-07581-7. BMC Genomics. 2021. PMID: 33858332 Free PMC article.
-
Integrated drug response prediction models pinpoint repurposed drugs with effectiveness against rhabdomyosarcoma.PLoS One. 2024 Jan 26;19(1):e0295629. doi: 10.1371/journal.pone.0295629. eCollection 2024. PLoS One. 2024. PMID: 38277404 Free PMC article.
-
A Web Application for Predicting Drug Combination Efficacy Using Monotherapy Data and IDACombo.J Cancer Sci Clin Ther. 2024;7(4):253-258. doi: 10.26502/jcsct.5079218. Epub 2023 Dec 8. J Cancer Sci Clin Ther. 2024. PMID: 38344217 Free PMC article.
References
-
- Garraway LA, Verweij J, Ballman KV. Precision oncology: an overview. J Clin Oncol. 2013;31:1803–5. - PubMed
-
- Holohan C, Van Schaeybroeck S, Longley DB, Johnston PG. Cancer drug resistance: an evolving paradigm. Nat Rev Cancer. 2013;13:714–26. - PubMed
-
- Garraway LA, Janne PA. Circumventing cancer drug resistance in the era of personalized medicine. Cancer Discov. 2012;2:214–26. - PubMed
-
- Sharma SV, Haber DA, Settleman J. Cell line-based platforms to evaluate the therapeutic efficacy of candidate anticancer agents. Nat Rev Cancer. 2010;10:241–53. - PubMed
-
- Shoemaker RH. The NCI60 human tumour cell line anticancer drug screen. Nat Rev Cancer. 2006;6:813–23. - PubMed
Publication types
MeSH terms
Substances
Grants and funding
LinkOut - more resources
Full Text Sources
Other Literature Sources
Miscellaneous

