

Suboptimization of developmental enhancers
- PMID: 26472909
- PMCID: PMC4970741
- DOI: 10.1126/science.aac6948
Suboptimization of developmental enhancers
Abstract
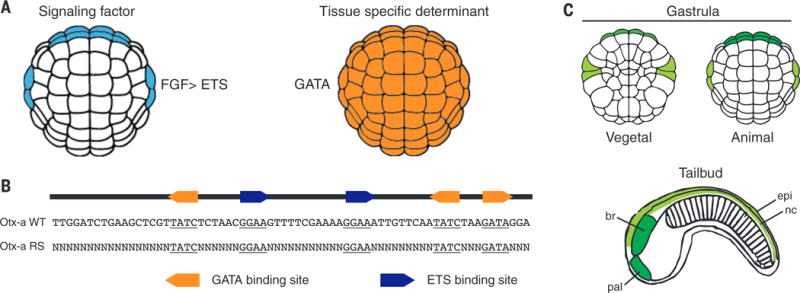
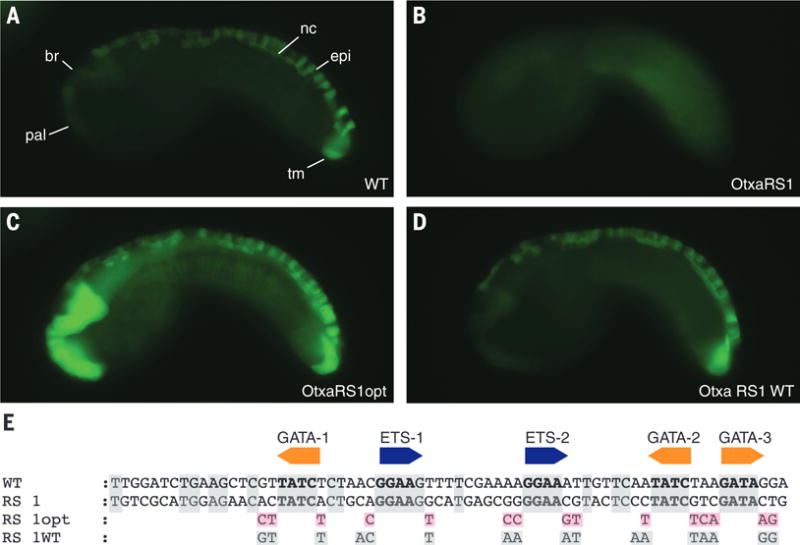
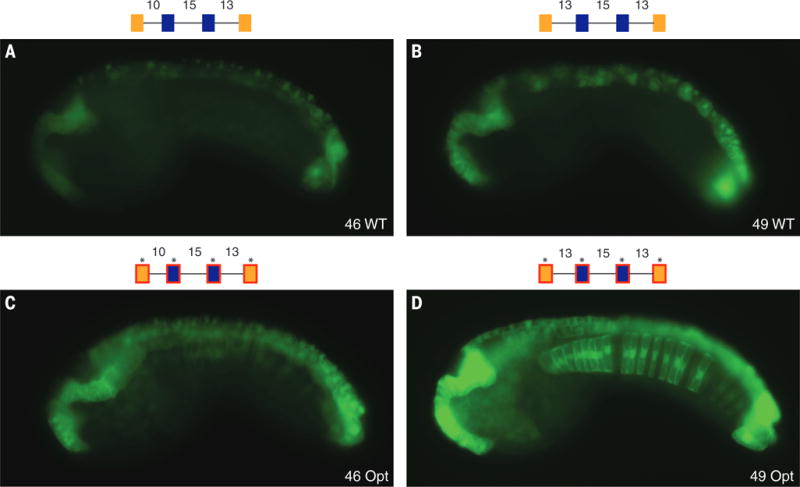
Transcriptional enhancers direct precise on-off patterns of gene expression during development. To explore the basis for this precision, we conducted a high-throughput analysis of the Otx-a enhancer, which mediates expression in the neural plate of Ciona embryos in response to fibroblast growth factor (FGF) signaling and a localized GATA determinant. We provide evidence that enhancer specificity depends on submaximal recognition motifs having reduced binding affinities ("suboptimization"). Native GATA and ETS (FGF) binding sites contain imperfect matches to consensus motifs. Perfect matches mediate robust but ectopic patterns of gene expression. The native sites are not arranged at optimal intervals, and subtle changes in their spacing alter enhancer activity. Multiple tiers of enhancer suboptimization produce specific, but weak, patterns of expression, and we suggest that clusters of weak enhancers, including certain "superenhancers," circumvent this trade-off in specificity and activity.
Copyright © 2015, American Association for the Advancement of Science.
Figures
Similar articles
-
Syntax compensates for poor binding sites to encode tissue specificity of developmental enhancers.Proc Natl Acad Sci U S A. 2016 Jun 7;113(23):6508-13. doi: 10.1073/pnas.1605085113. Epub 2016 May 6. Proc Natl Acad Sci U S A. 2016. PMID: 27155014 Free PMC article.
-
A cis-regulatory signature in ascidians and flies, independent of transcription factor binding sites.Curr Biol. 2010 May 11;20(9):792-802. doi: 10.1016/j.cub.2010.03.063. Epub 2010 Apr 29. Curr Biol. 2010. PMID: 20434338
-
Ciona Brachyury proximal and distal enhancers have different FGF dose-response relationships.PLoS Genet. 2021 Jan 19;17(1):e1009305. doi: 10.1371/journal.pgen.1009305. eCollection 2021 Jan. PLoS Genet. 2021. PMID: 33465083 Free PMC article.
-
Regulatory Principles Governing Tissue Specificity of Developmental Enhancers.Cold Spring Harb Symp Quant Biol. 2015;80:27-32. doi: 10.1101/sqb.2015.80.027227. Cold Spring Harb Symp Quant Biol. 2015. PMID: 27325706 Free PMC article. Review.
-
Reporter Analyses Reveal Redundant Enhancers that Confer Robustness on Cis-Regulatory Mechanisms.Adv Exp Med Biol. 2018;1029:69-79. doi: 10.1007/978-981-10-7545-2_7. Adv Exp Med Biol. 2018. PMID: 29542081 Review.
Cited by
-
Function and Constraint in Enhancer Sequences with Multiple Evolutionary Origins.Genome Biol Evol. 2022 Nov 4;14(11):evac159. doi: 10.1093/gbe/evac159. Genome Biol Evol. 2022. PMID: 36314566 Free PMC article.
-
A change in cis-regulatory logic underlying obligate versus facultative muscle multinucleation in chordates.Development. 2024 Oct 15;151(20):dev202968. doi: 10.1242/dev.202968. Epub 2024 Sep 3. Development. 2024. PMID: 39114943 Free PMC article.
-
Pioneer Transcription Factors Initiating Gene Network Changes.Annu Rev Genet. 2020 Nov 23;54:367-385. doi: 10.1146/annurev-genet-030220-015007. Epub 2020 Sep 4. Annu Rev Genet. 2020. PMID: 32886547 Free PMC article. Review.
-
Roles of transposable elements in the regulation of mammalian transcription.Nat Rev Mol Cell Biol. 2022 Jul;23(7):481-497. doi: 10.1038/s41580-022-00457-y. Epub 2022 Feb 28. Nat Rev Mol Cell Biol. 2022. PMID: 35228718 Free PMC article. Review.
-
The winding road toward transcriptional repression.Mol Cell. 2023 Mar 2;83(5):653-654. doi: 10.1016/j.molcel.2023.02.005. Mol Cell. 2023. PMID: 36868186 Free PMC article.
References
-
- Acampora D, et al. Brain Res Bull. 2005;66:410–420. - PubMed
-
- Beby F, Lamonerie T. Exp Eye Res. 2013;111:9–16. - PubMed
-
- Rothbächer U, Bertrand V, Lamy C, Lemaire P. Development. 2007;134:4023–4032. - PubMed
-
- Khoueiry P, et al. Curr Biol. 2010;20:792–802. - PubMed
-
- Bertrand V, Hudson C, Caillol D, Popovici C, Lemaire P. Cell. 2003;115:615–627. - PubMed
Publication types
MeSH terms
Substances
Associated data
Grants and funding
LinkOut - more resources
Full Text Sources
Other Literature Sources
