. 2015 Oct 14;90(1):129-41.
doi: 10.1128/JVI.01894-15. Print 2016 Jan 1.

Natural Killer Cells and Innate Interferon Gamma Participate in the Host Defense against Respiratory Vaccinia Virus Infection

Affiliations

Natural Killer Cells and Innate Interferon Gamma Participate in the Host Defense against Respiratory Vaccinia Virus Infection

Georges Abboud et al. J Virol. .

Abstract

In establishing a respiratory infection, vaccinia virus (VACV) initially replicates in airway epithelial cells before spreading to secondary sites of infection, mainly the draining lymph nodes, spleen, gastrointestinal tract, and reproductive organs. We recently reported that interferon gamma (IFN-γ) produced by CD8 T cells ultimately controls this disseminated infection, but the relative contribution of IFN-γ early in infection is unknown. Investigating the role of innate immune cells, we found that the frequency of natural killer (NK) cells in the lung increased dramatically between days 1 and 4 postinfection with VACV. Lung NK cells displayed an activated cell surface phenotype and were the primary source of IFN-γ prior to the arrival of CD8 T cells. In the presence of an intact CD8 T cell compartment, depletion of NK cells resulted in increased lung viral load at the time of peak disease severity but had no effect on eventual viral clearance, disease symptoms, or survival. In sharp contrast, RAG(-/-) mice devoid of T cells failed to control VACV and succumbed to infection despite a marked increase in NK cells in the lung. Supporting an innate immune role for NK cell-derived IFN-γ, we found that NK cell-depleted or IFN-γ-depleted RAG(-/-) mice displayed increased lung VACV titers and dissemination to ovaries and a significantly shorter mean time to death compared to untreated NK cell-competent RAG(-/-) controls. Together, these findings demonstrate a role for IFN-γ in aspects of both the innate and adaptive immune response to VACV and highlight the importance of NK cells in T cell-independent control of VACV in the respiratory tract.

Importance: Herein, we provide the first systematic evaluation of natural killer (NK) cell function in the lung after infection with vaccinia virus, a member of the Poxviridae family. The respiratory tract is an important mucosal site for entry of many human pathogens, including poxviruses, but precisely how our immune system defends the lung against these invaders remains unclear. Natural killer cells are a type of cytotoxic lymphocyte and part of our innate immune system. In recent years, NK cells have received increasing levels of attention following the discovery that different tissues contain specific subsets of NK cells with distinctive phenotypes and function. They are abundant in the lung, but their role in defense against respiratory viruses is poorly understood. What this study demonstrates is that NK cells are recruited, activated, and contribute to protection of the lung during a severe respiratory infection with vaccinia virus.


Figures

FIG 1
FIG 1
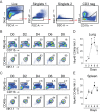
Lung and splenic NK cell responses to a respiratory VACV-WR infection. Wild-type C57BL/6J mice were infected intranasally with 1 × 10⁴ PFU of VACV-WR. (A) Representative gating strategy to identify NK cells among live mononuclear cells. NK cell subsets were identified by sequentially gating on live cells, the lymphocytic singlet population, and then CD3 cells. FSC, forward scatter; SSC, side scatter; A, signal area; W, signal width. Kinetic changes in lung (B and D) and spleen (C and E) NK cells were examined over 8 days postinfection (n = 3 per time point). (B and C) Top, representative FACS plots showing NK cells (CD11b+ NKp46+) as percentages of CD3 lymphocytes. Bottom, representative FACS plots showing NK1.1+ CD49b+ cells as percentages of NKp46+ NK cells. Total lung (D) and spleen (E) NK cell numbers are presented as the mean results ± SEM from three separate experiments containing 3 mice per group. Student's t test with Bonferroni correction was used to determine statistical significance. *, P < 0.05, control versus infected mice.
FIG 2
FIG 2
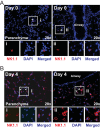
Localization of NK1.1+ cells in the lungs of VACV-WR-infected mice. Wild-type C57BL/6J mice were intranasally infected with 1.25 × 10⁴ PFU of VACV-WR. Lung tissue sections from mice infected with VACV-WR and uninfected control (day 0) mice were stained with DAPI (blue) and for NK1.1 (red) and analyzed by confocal microscopy (20× objective; scale bar = 100 mm). NK1.1+ cells were visualized in the lung parenchyma and lamina propria of bronchioles and airway epithelial cells. Representative pictures taken from animals on day 0 (A) and day 4 (B) postinfection are shown. Arrows point at NK1.1+ cells. Insets shows NK1.1+ cells in the lung tissue of infected animals on the indicated days. Results are representative of three experiments each with three mice per group.
FIG 3
FIG 3
Respiratory VACV-WR infection induces NK cell activation and proliferation. Wild-type C57BL/6J (WT) mice were intranasally infected with 1.25 × 10⁴ PFU of VACV-WR. On the indicated days postinfection, lung, spleen, and bone marrow (BM) NK cells (CD3 NKp46+ NK1.1+) were examined for phenotypic and functional markers by flow cytometry. (A) Expression of CD11b and CD27 by gated CD3 NKp46+ NK1.1+ cells in mock-infected (day zero [D0]) and VACV-infected mice. The quadrants show the three major NK subsets (CD11blow CD27high, CD11bhigh CD27high, and CD11bhigh CD27low). (B) Representative FACS plots showing the percentages of NK cell proliferation by Ki67 staining among CD3 NKp46+ NK1.1+ cells in mock-infected (D0) and VACV-infected mice. The numbers in the plots indicate the percentages of NK1.1+ cells that stained for Ki67. (C) Representative FACS plots showing cell surface expression levels of CD69, CD44, CD43, and KLRG by lung NKp46+ NK1.1+ cells on day 5 postinfection. The results shown are representative of three experiments each with three mice per group.
FIG 4
FIG 4
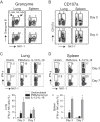
NK cells express cytolytic effector molecules and release IFN-γ after respiratory VACV-WR infection. Wild-type C57BL/6J (WT) mice were intranasally infected with 1.25 × 10⁴ PFU of VACV-WR. On day 4 postinfection, total lung (left) and spleen (right) cells were stained for cell surface expression of NK1.1+, NKp46+, and intracellular granzyme (A) and CD107a (B). Uninfected (naive) mice (day 0) were used as controls. The numbers displayed in quadrants within the zebra plots indicate the percentages of granzyme B- or CD107a-positive cells. On days 3 and 7 postinfection, total lung (C) and spleen (D) cells were stimulated ex vivo with either PMA-ionomycin or IL-12 plus IL-18 and subsequently stained for intracellular IFN-γ. Representative zebra plots for IFN-γ staining by CD3 NK1.1+ NKp46+-gated NK cells are shown. The numbers in the plots indicate the percentages of NK1.1+ NKp46+ cells that stained for IFN-γ+. Quadrant settings were based on the results for infected cells that were not stimulated with PMA-ionomycin or IL-12 plus IL-18 (medium alone). Similar results were obtained in three separate experiments.
FIG 5
FIG 5
In vivo expression of IFN-γ by NK cells following a respiratory VACV-WR infection. Interferon-gamma reporter with endogenous poly(A) transcript (GREAT) (B6.129s4-Ifngtm3.1Lky/J) mice were intranasally (i.n.) infected with a sublethal inoculum of VACV-WR (1.25 × 10⁴ PFU/mouse). On the specified days postinfection, the percentages and absolute numbers of lung and spleen eYFP–IFN-γ+ NK1.1+ cells (A and B), CD8 T cells (C), and CD4 T cells (D) were determined. C57BL/6 mice were used as negative controls (B6). Representative FACS plots and total cell counts from one experiment are presented. Similar results were obtained in three separate experiments. The numbers in the plots indicate the percentages of NK1.1+ cells that stained for eYFP–IFN-γ+. Student's t test with Bonferroni correction was used to determine statistical significance. *, P < 0.05, control versus infected mice. On day 6 postinfection, frozen lung (E) and spleen (F) sections were stained with rat anti-mouse NK1.1 antibodies and DAPI as indicated. The images were captured by a 20× objective using the EVOS fl inverted microscope. The micrographs show localization of NK1.1+ cells (red), DAPI (purple), and eYFP–IFN-γ+ (green) in lung parenchyma (C) and the splenic red pulp, white pulp, and bridging channels (D).
FIG 6
FIG 6
In vivo expression of IFN-γ by lung innate immune and B cells following a respiratory VACV-WR infection. Interferon gamma reporter with endogenous poly(A) transcript (GREAT) (B6.129s4-Ifngtm3.1Lky/J) mice were intranasally (i.n.) infected with a sublethal inoculum of VACV-WR (1.25 × 10⁴ PFU/mouse). (A) Gating strategy to identify cell subsets in VACV-infected lungs. DC, dendritic cells; MHC-II+, major histocompatibility complex II-positive cells; Macro, macrophages; Eo, eosinophils; Mono, monocytes; Neutro, neutrophils. (B) On the specified days postinfection, the percentages of lung eYFP–IFN-γ+ B cells, inflammatory monocytes (Inflam. Mono.), DC, neutrophils, eosinophils, and macrophages were determined. VACV-infected C57BL/6 mice were used as the negative control. The numbers in the plots indicate the percentages of cells that stained for eYFP–IFN-γ+.
FIG 7
FIG 7
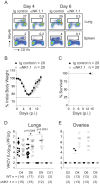
Depletion of NK cells leads to an increase in VACV replication in the lung but does not alter disease symptoms, viral clearance, or survival. Wild-type (WT) C57BL/6J mice were intranasally infected with VACV-WR (1.25 × 10⁴ PFU/mouse). Mice were treated with a depleting anti-NK1.1 MAb (clone PK136) or PBS starting 1 day before infection (day −1) and then every 2 days over the course of the study. (A) Four and 6 days after infection, mice were sacrificed, and lung tissues (top) and splenocytes (bottom) were stained with anti-CD3, anti-CD11b, and anti-NKp46 antibodies. The events were gated on CD3 cells, and the percentages of NKp46+ cells among the gated population are shown. Body mass (B) and survival (C) were monitored daily in both PBS control and NK1.1-depleted mice. At the indicated times after infection, lung (D) and ovary (E) tissue homogenates were prepared and assayed for infectious VACV by plaque assay on VERO cells. The dashed lines indicate the minimum detection limit of the plaque assay. Symbols indicate the results for individual mice, and lines indicate the mean results. Student's t test with Bonferroni correction was used to determine statistical significance. *, P < 0.05, NK cell-depleted mice versus nondepleted control mice.
FIG 8
FIG 8
NK cell depletion does not influence the CD8 T cell response elicited in the lungs of mice infected with VACV. Wild-type (WT) C57BL/6J and NK cell-depleted mice were intranasally infected with 1.25 × 10⁴ PFU of VACV-WR. On days 4 and 6 postinfection, total lung (A and C) and spleen (B and D) cells were stained for CD3ε, CD4 CD8α, CD44, and B8R tetramer. Representative plots for CD4 and CD8 staining gated on CD3ε+ cells (A and B) and B8R tetramer staining (C and D) gated on CD8α+ cells are shown. The percentages and total numbers of CD3ε+ CD4+, CD3ε+ CD8α, CD3ε+ CD8α+ CD44high, and B8R tetramer-positive T cells are also quantified. The results shown are the means ± SEM (n = 3 mice/group) from one experiment. Similar results were obtained in three separate experiments. Student's t test with Bonferroni correction was used to determine statistical significance.
FIG 9
FIG 9
Enhanced NK cell responses in T cell-deficient RAG−/− mice infected with VACV-WR. Wild-type (WT), RAG−/−, and RAG−/− IL-2Rγ−/− C57BL/6J mice were infected intranasally with 1.25 × 10⁴ or 1.25 × 10³ PFU of VACV-WR, as indicated. (A) Representative FACS plots from day 9 postinfection showing NK cells (CD11b+ NKp46+) as percentages of CD3 lymphocytes. Right, histogram showing NK cell numbers presented as the mean results ± SEM from two separate experiments; n = 3 mice/group. Student's t test with the Bonferroni correction was used to determine statistical significance. *, P < 0.05, WT versus RAG−/−-infected mice. (B) On day 9 postinfection, lung cells were stained with anti-CD3, anti-NK1.1, and anti-Nkp46 antibodies and for Ki67 and assayed for NK cell proliferation and CD11b and CD69 expression on NK cells. (C) On day 9 postinfection with VACV-WR (1.25 × 10⁴ PFU), total lung cells were stimulated ex vivo with either PMA-ionomycin or IL-12 plus IL-18 for 5 h and then stained for intracellular IFN-γ. Representative zebra plots are shown for IFN-γ staining of CD3 NK1.1+-gated NK cells. The numbers in the plots indicate the percentages of NK1.1+ cells that stained for IFN-γ. Quadrant settings were based on the results for controls, using infected cells that were not stimulated (medium alone) with PMA-ionomycin or IL-12 and IL-18. Similar results were obtained in two separate experiments. (D) On day 9 postinfection with VACV-WR (1.25 × 10⁴ PFU), lungs were isolated and total RNA was collected. IFN-γ transcript levels were measured by real-time RT-PCR. Levels of mRNA were standardized to the level of the L32 housekeeping gene. Symbols indicate the results for individual mice, and bars- and whiskers indicate the mean results ± SEM. Student's t test with Bonferroni correction was used to determine statistical significance. *, P < 0.05 for RAG−/− versus RAG−/−/IL-2Rγ−/− mice.
FIG 10
FIG 10
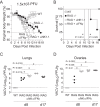
NK cells and IFN-γ participate in innate defense against respiratory VACV infection. Wild-type C57BL/6J, and RAG−/− mice were infected intranasally with 1.25 × 10³ of VACV-WR. Weight loss (A) and survival (B) were monitored in RAG−/− mice that were continuously treated with a depleting anti-NK1.1 MAb (clone PK136), neutralizing anti-IFN-γ MAb (clone XMG.1), or PBS control starting 1 day before infection and then every 2 days over the course of the study. Weight loss data are presented as the mean results ± SEM from two separate experiments with three to five mice per group and analyzed using two-way ANOVA to determine statistical significance. Survival data comprise combined survival data across combined experiments analyzed using the Mantel-Cox test. *, P < 0.05. At the indicated times after infection, lung (C) and ovary (D) tissue homogenates were prepared and assayed for infectious VACV by plaque assay on VERO cells. The dashed line indicates the minimum detection limit of the plaque assay. Data are presented as the mean results ± 1 SEM from two independent experiments with three to five mice per group. Student's t test with Bonferroni correction was used to determine statistical significance of viral titer results. *, P < 0.05, NK cell-depleted or IFN-γ-depleted versus nondepleted RAG−/− mice.

Similar articles

Cited by

References

    1. Buller RM, Palumbo GJ. 1991. Poxvirus pathogenesis. Microbiol Rev 55:80–122. - PMC - PubMed
    1. Di Giulio DB, Eckburg PB. 2004. Human monkeypox: an emerging zoonosis. Lancet Infect Dis 4:15–25. doi:10.1016/S1473-3099(03)00856-9. - DOI - PMC - PubMed
    1. de Souza Trindade G, Drumond BP, Guedes MI, Leite JA, Mota BE, Campos MA, da Fonseca FG, Nogueira ML, Lobato ZI, Bonjardim CA, Ferreira PC, Kroon EG. 2007. Zoonotic vaccinia virus infection in Brazil: clinical description and implications for health professionals. J Clin Microbiol 45:1370–1372. doi:10.1128/JCM.00920-06. - DOI - PMC - PubMed
    1. Cann JA, Jahrling PB, Hensley LE, Wahl-Jensen V. 2013. Comparative pathology of smallpox and monkeypox in man and macaques. J Comp Pathol 148:6–21. doi:10.1016/j.jcpa.2012.06.007. - DOI - PMC - PubMed
    1. Nelson JB. 1938. The behavior of pox viruses in the respiratory tract. I. The response of mice to the nasal instillation of vaccinia virus. J Exp Med 68:401–412. - PMC - PubMed

Publication types

Substances

LinkOut - more resources