Impact of peripheral myeloid cells on amyloid-β pathology in Alzheimer's disease-like mice
- PMID: 26458768
- PMCID: PMC4612091
- DOI: 10.1084/jem.20150479
Impact of peripheral myeloid cells on amyloid-β pathology in Alzheimer's disease-like mice
Abstract
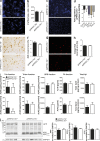
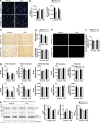
Although central nervous system-resident microglia are believed to be ineffective at phagocytosing and clearing amyloid-β (Aβ), a major pathological hallmark of Alzheimer's disease (AD), it has been suggested that peripheral myeloid cells constitute a heterogeneous cell population with greater Aβ-clearing capabilities. Here, we demonstrate that the conditional ablation of resident microglia in CD11b-HSVTK (TK) mice is followed by a rapid repopulation of the brain by peripherally derived myeloid cells. We used this system to directly assess the ability of peripheral macrophages to reduce Aβ plaque pathology and therefore depleted and replaced the pool of resident microglia with peripherally derived myeloid cells in Aβ-carrying APPPS1 mice crossed to TK mice (APPPS1;TK). Despite a nearly complete exchange of resident microglia with peripheral myeloid cells, there was no significant change in Aβ burden or APP processing in APPPS1;TK mice. Importantly, however, newly recruited peripheral myeloid cells failed to cluster around Aβ deposits. Even additional anti-Aβ antibody treatment aimed at engaging myeloid cells with amyloid plaques neither directed peripherally derived myeloid cells to amyloid plaques nor altered Aβ burden. These data demonstrate that mere recruitment of peripheral myeloid cells to the brain is insufficient in substantially clearing Aβ burden and suggest that specific additional triggers appear to be required to exploit the full potential of myeloid cell-based therapies for AD.
© 2015 Prokop et al.
Figures


Comment in
-
Peripheral macrophages not ADept at amyloid clearance.J Exp Med. 2015 Oct 19;212(11):1758. doi: 10.1084/jem.21211insight5. J Exp Med. 2015. PMID: 26482143 Free PMC article. No abstract available.
Similar articles
-
Replacement of brain-resident myeloid cells does not alter cerebral amyloid-β deposition in mouse models of Alzheimer's disease.J Exp Med. 2015 Oct 19;212(11):1803-9. doi: 10.1084/jem.20150478. Epub 2015 Oct 12. J Exp Med. 2015. PMID: 26458770 Free PMC article.
-
Cytokine-producing microglia have an altered beta-amyloid load in aged APP/PS1 Tg mice.Brain Behav Immun. 2015 Aug;48:86-101. doi: 10.1016/j.bbi.2015.03.006. Epub 2015 Mar 12. Brain Behav Immun. 2015. PMID: 25774009
-
Distinct and non-redundant roles of microglia and myeloid subsets in mouse models of Alzheimer's disease.J Neurosci. 2011 Aug 3;31(31):11159-71. doi: 10.1523/JNEUROSCI.6209-10.2011. J Neurosci. 2011. PMID: 21813677 Free PMC article.
-
Clearance of cerebral Aβ in Alzheimer's disease: reassessing the role of microglia and monocytes.Cell Mol Life Sci. 2017 Jun;74(12):2167-2201. doi: 10.1007/s00018-017-2463-7. Epub 2017 Feb 14. Cell Mol Life Sci. 2017. PMID: 28197669 Free PMC article. Review.
-
Microglia receptors and their implications in the response to amyloid β for Alzheimer's disease pathogenesis.J Neuroinflammation. 2014 Mar 13;11:48. doi: 10.1186/1742-2094-11-48. J Neuroinflammation. 2014. PMID: 24625061 Free PMC article. Review.
Cited by
-
Neuroimmune interactions in Alzheimer's disease-New frontier with old challenges?Prog Mol Biol Transl Sci. 2019;168:183-201. doi: 10.1016/bs.pmbts.2019.10.002. Epub 2019 Oct 24. Prog Mol Biol Transl Sci. 2019. PMID: 31699314 Free PMC article. Review.
-
Activated Bone Marrow-Derived Macrophages Eradicate Alzheimer's-Related Aβ42 Oligomers and Protect Synapses.Front Immunol. 2020 Jan 31;11:49. doi: 10.3389/fimmu.2020.00049. eCollection 2020. Front Immunol. 2020. PMID: 32082319 Free PMC article.
-
Peripheral and central immune system crosstalk in Alzheimer disease - a research prospectus.Nat Rev Neurol. 2021 Nov;17(11):689-701. doi: 10.1038/s41582-021-00549-x. Epub 2021 Sep 14. Nat Rev Neurol. 2021. PMID: 34522039 Free PMC article. Review.
-
Microglia at sites of atrophy restrict the progression of retinal degeneration via galectin-3 and Trem2.J Exp Med. 2024 Mar 4;221(3):e20231011. doi: 10.1084/jem.20231011. Epub 2024 Jan 30. J Exp Med. 2024. PMID: 38289348 Free PMC article.
-
Novel alterations in corneal neuroimmune phenotypes in mice with central nervous system tauopathy.J Neuroinflammation. 2020 Apr 28;17(1):136. doi: 10.1186/s12974-020-01803-7. J Neuroinflammation. 2020. PMID: 32345316 Free PMC article.
References
-
- Chakrabarty P., Li A., Ceballos-Diaz C., Eddy J.A., Funk C.C., Moore B., DiNunno N., Rosario A.M., Cruz P.E., Verbeeck C., et al. . 2015. IL-10 alters immunoproteostasis in APP mice, increasing plaque burden and worsening cognitive behavior. Neuron. 85:519–533. 10.1016/j.neuron.2014.11.020 - DOI - PMC - PubMed
Publication types
MeSH terms
Substances
LinkOut - more resources
Full Text Sources
Other Literature Sources
Medical
Molecular Biology Databases
Research Materials

