. 2015 Nov;33(11):1165-72.
doi: 10.1038/nbt.3383. Epub 2015 Oct 12.

Single-cell ChIP-seq reveals cell subpopulations defined by chromatin state

Affiliations

Single-cell ChIP-seq reveals cell subpopulations defined by chromatin state

Assaf Rotem et al. Nat Biotechnol. 2015 Nov.

Abstract

Chromatin profiling provides a versatile means to investigate functional genomic elements and their regulation. However, current methods yield ensemble profiles that are insensitive to cell-to-cell variation. Here we combine microfluidics, DNA barcoding and sequencing to collect chromatin data at single-cell resolution. We demonstrate the utility of the technology by assaying thousands of individual cells and using the data to deconvolute a mixture of ES cells, fibroblasts and hematopoietic progenitors into high-quality chromatin state maps for each cell type. The data from each single cell are sparse, comprising on the order of 1,000 unique reads. However, by assaying thousands of ES cells, we identify a spectrum of subpopulations defined by differences in chromatin signatures of pluripotency and differentiation priming. We corroborate these findings by comparison to orthogonal single-cell gene expression data. Our method for single-cell analysis reveals aspects of epigenetic heterogeneity not captured by transcriptional analysis alone.


Figures

Figure 1
Figure 1. Overview of Drop-ChIP procedure for acquiring single cell chromatin data
A) Microfluidics workflow. A library of drops containing DNA barcodes is prepared by emulsifying DNA suspensions from plates (top left). Cells are encapsulated and lysed in drops, and their chromatin is fragmented (bottom left). Chromatin-bearing drops and barcode drops are merged in a microfluidic device, and DNA barcodes are ligated to the chromatin fragments, thus indexing them to originating cell. B) Combined contents of many drops are immunoprecipitated in the presence of ‘carrier’ chromatin and the enriched DNA is sequenced. C) Sequencing reads are partitioned by their barcode sequences to yield single cell chromatin profiles (left). An unsupervised algorithm identifies groups of related single cell profiles, which are then aggregated to produce high-quality chromatin profiles for sub-populations (right). See also Supplementary Figure 1.
Figure 2
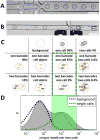
Figure 2. Labeling single-cell chromatin by drop-based microfluidics
A) Micrograph shows an aqueous suspension of cells (‘S’) co-flowed together with lysis buffer and MNase (‘B’) as they enter the drop maker junction and disperse in oil (‘O’), resulting in the formation of cell-bearing drops (see also Supplementary Movie 1). B) Micrograph shows cell-bearing drops (∼50um diameter) and barcode-bearing drops (∼30um diameter) paired in a microfluidics “3-point merger” device. As adjacent drops flow by the electrodes (+-), an induced electric field triggers their coalescence; simultaneously, labeling buffer (B) containing ligase is injected into the merged drops (Supplementary Movie 2). C) Table depicts estimated frequencies of possible drop fusion outcomes. The number of cells in each drop was measured from Supplementary Movie 1 (see Panel A). Drops containing cells or cell debris may fuse with one (90%) or two (10%) barcode drops (green frame). Two-barcodes fusion events can be detected and corrected in silico. Background reads contributed by drops that only contain cell debris are also filtered in silico. D) The frequency distribution of barcodes is plotted as a function of the number of reads contributed by each barcode and fitted to a sum of two Poisson distributions, one for the background reads (blue) and one for the single-cells reads (green, see Methods). Barcodes in the highlighted range are assumed to originate from single cells, and retained for further analysis. Scale bars are 100um.
Figure 3
Figure 3. Symmetric barcoding and amplification of chromatin fragments
A) Barcode adapters (top) are 64 bp double-stranded oligonucleotides with universal primers, barcode sequences and restriction sites, whose symmetric design allows ligation on either side. Schematic (bottom left) depicts possible outcomes of ligation in drops, including symmetrically labeled nucleosomes, asymmetrically labeled nucleosomes, and adapter concatemers. Concatemers are removed by digestion of PacI sites formed by adapter juxtaposition (bottom center), allowing selective PCR amplification of symmetrically adapted chromatin fragments (bottom right). See also Supplementary Figure 2. B) Gel electrophoresis for DNA products at successive assay stages: left: DNA ladder; MNase: DNA fragments purified after capture, lysis and MNase digestion of single cells in drops confirm efficient digestion to mononucleosomes (∼1 million drops collected); Concat: Illumina library prepared from adaptor-ligated chromatin fragments without PacI digestion reveals overwhelming concatemer bias. Library: Illumina library prepared from adaptor-ligated chromatin fragments digested with PacI, reveals appropriate MNase digestion pattern, shifted by the size of barcode and Illumina adapters. C) Pie charts depict numbers of uniquely aligned sequencing read that satisfy successive filtering criteria (values reflect data from 100 single cells, averaged over 82 trials). We select reads that have barcode sequences on both ends (top) with matching sequence (middle). We then apply a Poisson model to identify barcodes that represent single cells (bottom). D) Heatmap depicts homogeneity of barcode selection. Barcodes (rows) are colored according to their relative prevalence (rank order) across 37 experiments (columns). The absence of bias towards particular barcodes (light or dark horizontal stripes) indicates the homogeneity of the barcode library. The mean normalized rank over all barcodes (right) is close to 0.5, consistent with balanced representation. E) Stability of the barcode library emulsion over time. The fraction of reads with matching barcodes on both ends is plotted as a function of time from encapsulation of the barcode library. F) The microfluidics system was applied to barcode a mixed suspension of human and mouse cells. For each barcode, plot depicts the number of reads aligning to the mouse genome (y-axis) versus the number of reads aligning to the human genome (x-axis). The data suggest that a vast majority of barcodes is unique to a single cell.
Figure 4
Figure 4. Single-cell H3K4me3 chromatin data inform about subpopulations of known cell types
A) Selected Drop-ChIP data is shown for 50 ES cells (ESCs) and 50 MEFs across representative gene loci. Each row represents data from a single cell. Each column includes reads in 330kb regions centered on selected genes (Anxa1: chr19: 20465000, m6p3: chr6: 122269000, Egr2: chr10: 67022000, Ring1B: chr17: 34262000, Cyb5d1: chr11: 69207000, Ctbp2: chr7: 140254000, Pou5f1: chr17: 35612000, Sox2: chr3: 34573000). A high proportion of reads aligns to genomic positions enriched in both bulk ChIP-seq assays (‘Bulk’) and aggregated chromatin profiles from 200 single-cell (‘200’), providing evidence that single-cell data are informative. B) The precision (fraction of single-cell reads overlapping known H3K4me3 peaks) and sensitivity (fraction of known H3K4me3 peaks occupied by single cell reads) are plotted for the top 50 ES cells by sensitivity and for all ES cells in the dataset. These data are compared to random profiles simulated by arbitrarily positioning reads. The average ES cell H3K4me3 profile has a precision of 53%±12% and a sensitivity of 7%±4%, while the average ES cell H3K4me2 profile has a precision of 42%±5% and a sensitivity of 3%±2% (not shown). C) For 400 single-cell H3K4me3 profiles, scatterplot depicts normalized detection of ES cell-specific intervals versus MEF-specific intervals. In this experiment, ES cells (red) and MEFs (green) were separately barcoded in the microfluidics device, but collectively immunoprecipitated and processed. A naive classification (black line) distinguishes ES cell profiles from MEF profiles with >95% specificity and sensitivity. D) ES cells, MEFs and EML cells were separately barcoded but collectively processed to acquire 883 single-cell profiles (314 ES cells, 376 MEFs, 193 EMLs). These profiles were clustered using an unsupervised divisive hierarchical clustering algorithm (see Methods). The hierarchal tree discriminates between cell types with >95% accuracy, indicating that the information content of single-cell profiles is sufficient to accurately group related cells and thereby distinguish cell states within a mixed population. See also Supplementary Figures 3 – 6 and Methods.
Figure 5
Figure 5. A spectrum of ES cell sub-populations with variable chromatin signatures for pluripotency and priming
A) Singe-cell H3K4me2 data for 4,643 ES cells and 762 MEFs were subjected to agglomerative hierarchical clustering based on their scores in 91 signature sets of genomic regions (see Methods). Pie chart (left) depicts the proportions of individual ES cells that cluster into each of three clusters (1436 cells in ES1, 1550 cells in ES2 and 1648 cells in ES3). Pie chart (right) depicts the relative numbers of ES cells and MEFs that cluster into a fourth group, which corresponds to MEFs. Heatmap (below) depicts the mean signature scores (rows) for each cluster (columns). B) Multidimensional scaling (MDS) plot compares the chromatin landscapes of single ES cells and MEFs (colored dots). The distance between any two dots (cells) approximates the distance between their 91-dimensional signature vectors. The plot shows 1,000 single cells (randomly sampled from the 5,405 cells with H3K4me2 data), colored by their cluster association. Tight co-localization of the MEF cluster and, to a lesser degree, the ES1 cluster suggests that the corresponding landscapes are relatively more homogeneous. In contrast, the ES2 and ES3 clusters are more broadly distributed and may reflect a gradient of single cell states. C) MDS plot as in B, but with indication of cells (black) that frequently switched clusters in bootstrapping tests on varying subsets of cells (see Methods). These unstable cells are exclusively located on the borders between clusters. D) Violin plots show the distribution of peak widths for peaks called from aggregate ES1, ES2 or ES3 profiles (see Methods). E) Venn diagram depicts the relative numbers and overlaps of peaks called from aggregate ES1, ES2 or ES3 profiles. The ES1 cluster is notable for higher pluripotency signature scores, larger numbers of peaks and tighter internal concordance. In contrast, the ES3 cluster has higher activity over Polycomb signatures and increased heterogeneity, potentially reflecting a mixture of primed states. See also Supplementary Figure 7–8, Supplementary Table 5 and Supplementary Note 1.
Figure 6
Figure 6. Orthogonal single-cell assays corroborate ES cell sub-populations and cell-to-cell variability in regulatory programs
A) The distribution of single-cell scores for 8 dominant signatures is plotted for ES1, ES2 and ES3. Vertical lines depict the mean score of each signature in MEFs. DNAme signature consists of 10,000 regions identified by Kelsey et. al. as most variable in their methylation status in ES cells. B) Heat map depicts positive and negative correlations between 6 selected signatures, based on co-variation of H3K4me2 across single ES cells. C) Heat map depicts positive and negative correlations between 6 selected signatures, based on co-variation of expression across single ES cells (See Supplementary Note 2). D) Scatterplot depicts correlations between indicated signature pairs across single ES cells, as determined from H3K4me2 or RNA expression data. Best fit line and Pearson correlation are also indicated. Thus, orthogonal single-cell techniques lead to similar conclusions regarding ES cell sub-populations and underlying patterns of variability in pluripotency and Polycomb signatures, suggestive of a continuum from pluripotent to primed states. See also Supplementary Figure 10.

Comment in

Similar articles

Cited by

References

Bibliography and references cited

    1. Rivera CM, Ren B. Mapping human epigenomes. Cell. 2013;155:39–55. - PMC - PubMed
    1. Baylin SB, Jones PA. A decade of exploring the cancer epigenome - biological and translational implications. Nature reviews Cancer. 2011;11:726–734. - PMC - PubMed
    1. Consortium EP, et al. An integrated encyclopedia of DNA elements in the human genome. Nature. 2012;489:57–74. - PMC - PubMed
    1. Ernst J, et al. Mapping and analysis of chromatin state dynamics in nine human cell types. Nature. 2011;473:43–49. - PMC - PubMed
    1. Shalek AK, et al. Single-cell transcriptomics reveals bimodality in expression and splicing in immune cells. Nature. 2013;498:236–240. - PMC - PubMed

Bibliography and References Cited in Online Methods Only

    1. Kumar RM, et al. Deconstructing transcriptional heterogeneity in pluripotent stem cells. Nature. 2014;516:56–61. - PMC - PubMed
    1. Mazutis L, et al. Single-cell analysis and sorting using droplet-based microfluidics. Nature protocols. 2013;8:870–891. - PMC - PubMed
    1. Langmead B, Salzberg SL. Fast gapped-read alignment with Bowtie 2. Nature methods. 2012;9:357–359. - PMC - PubMed
    1. Guttman M, et al. Ab initio reconstruction of cell type-specific transcriptomes in mouse reveals the conserved multi-exonic structure of lincRNAs. Nature Biotechnology. 2010;28:503–510. - PMC - PubMed
    1. Venables WN. Modern applied statistics with S. 4th. Springer; New York: 2002.

Publication types