. 2015 Nov 3;23(11):2122-32.
doi: 10.1016/j.str.2015.08.016. Epub 2015 Oct 9.

The Interaction of CCDC104/BARTL1 with Arl3 and Implications for Ciliary Function

Affiliations

The Interaction of CCDC104/BARTL1 with Arl3 and Implications for Ciliary Function

Mandy Lokaj et al. Structure. .

Abstract

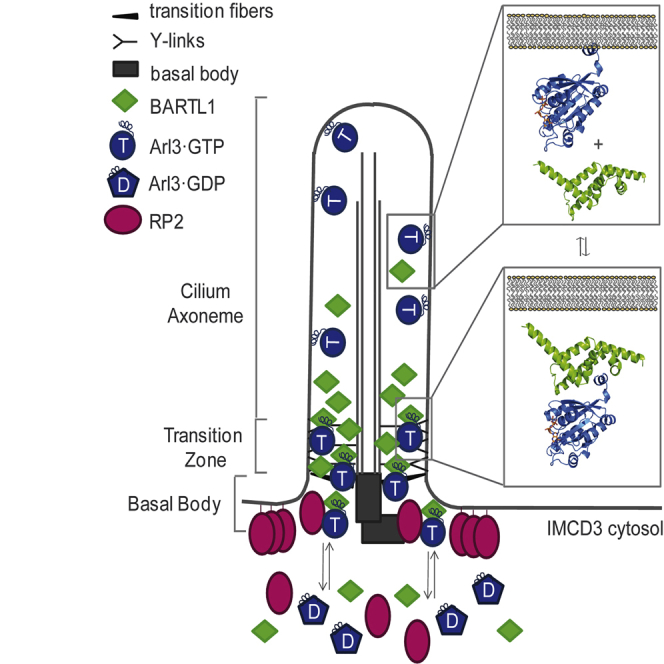
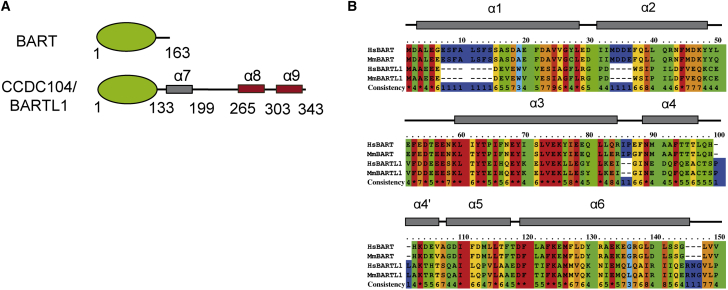
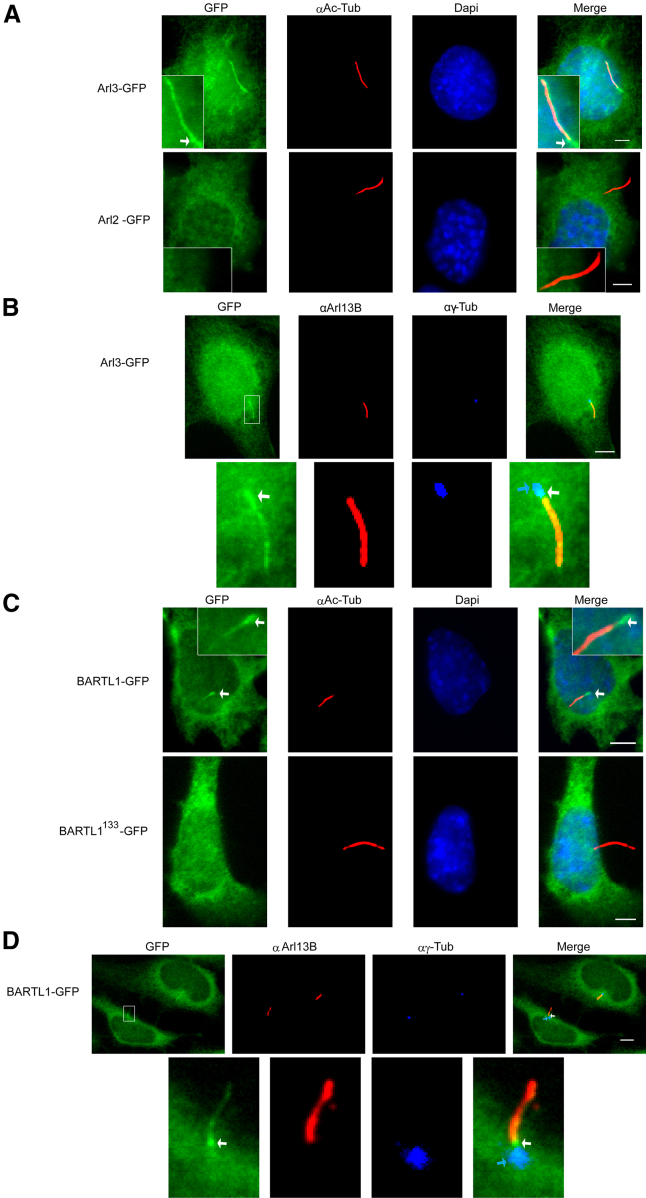
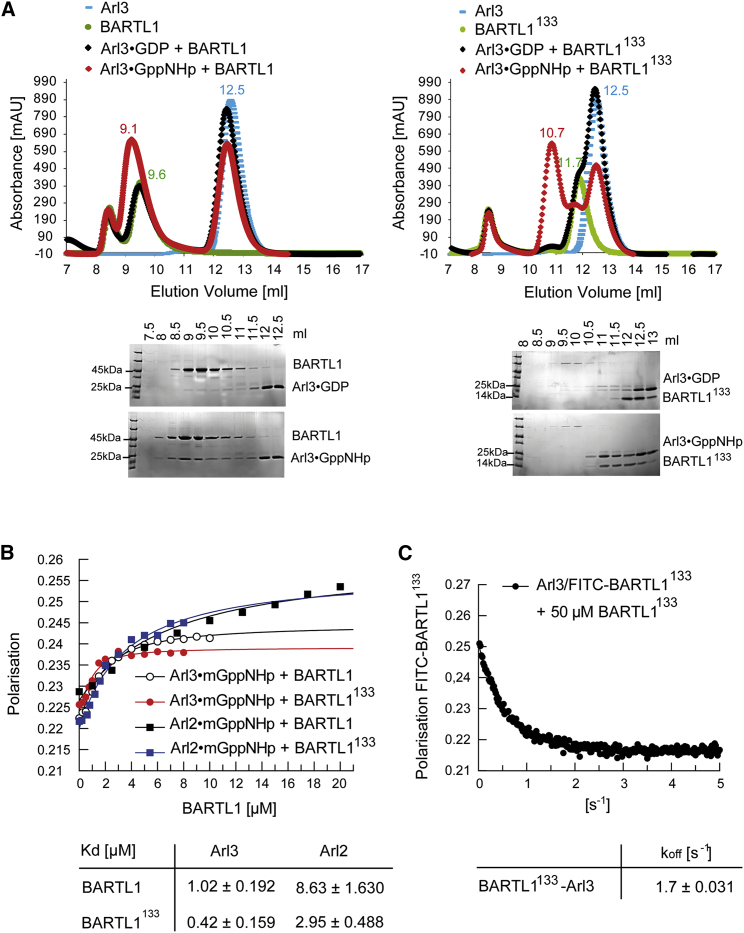
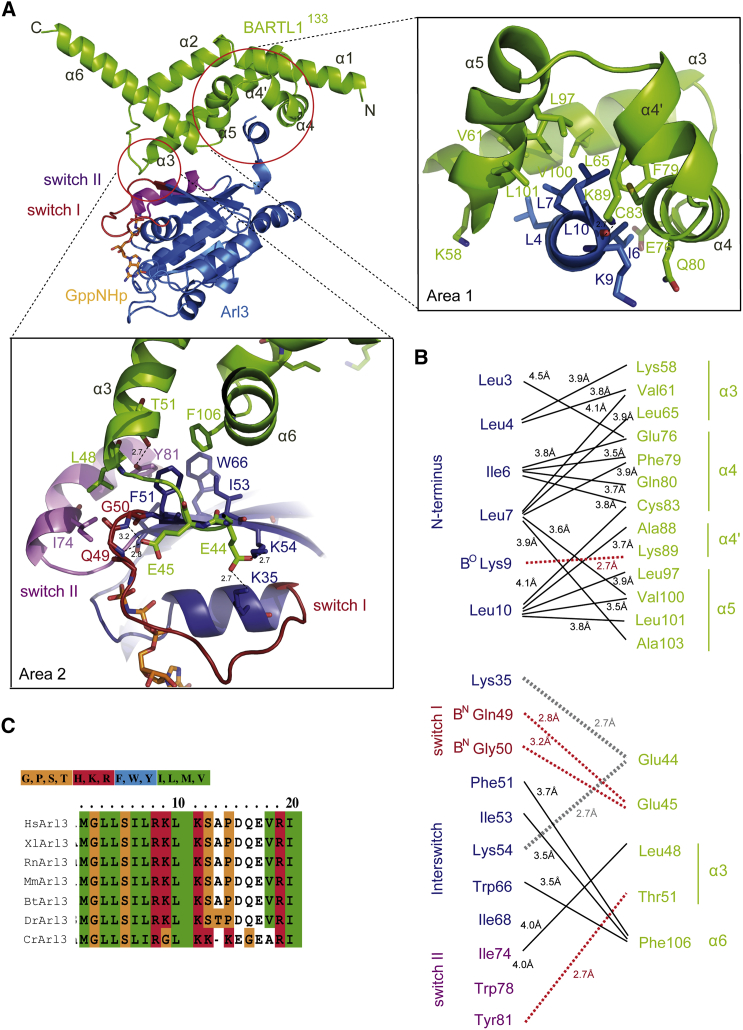
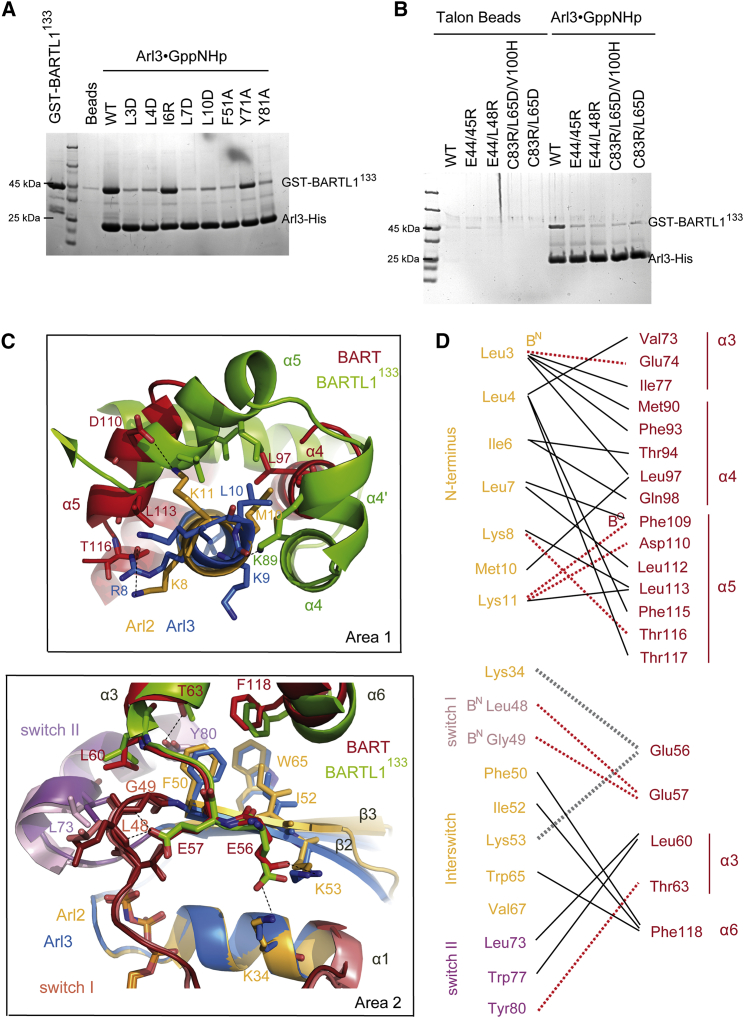
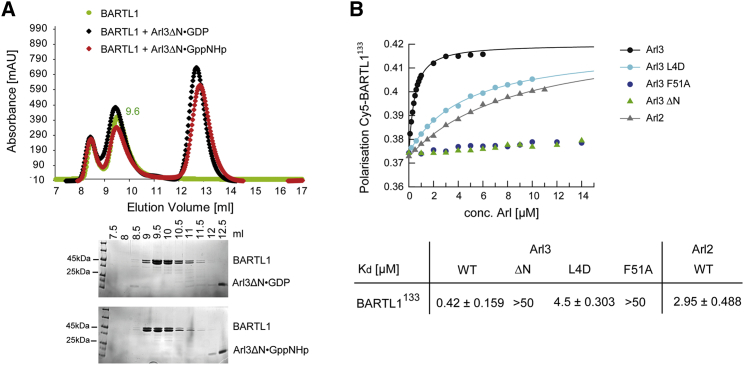
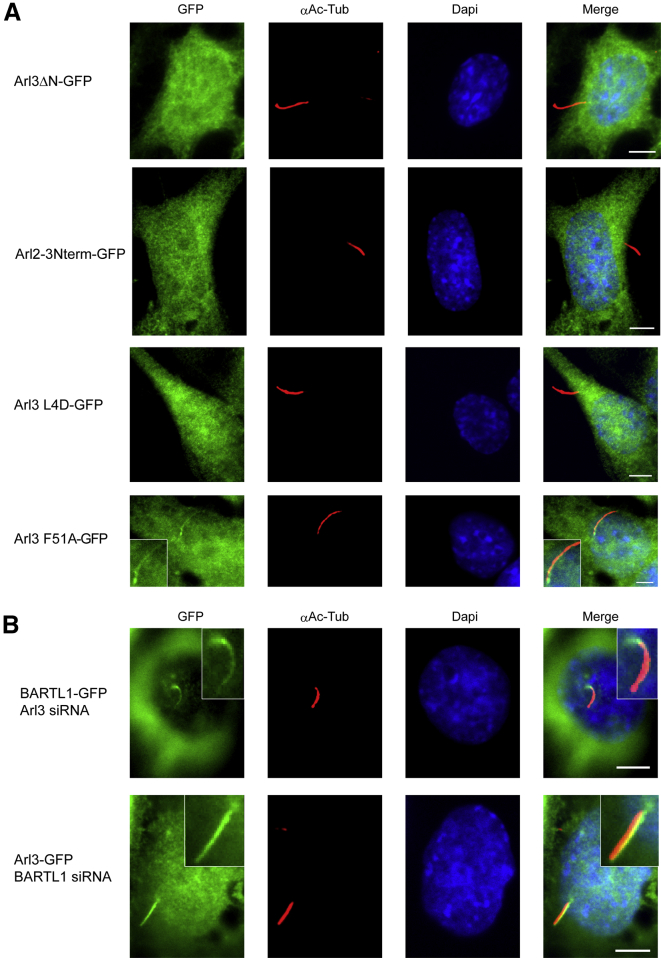
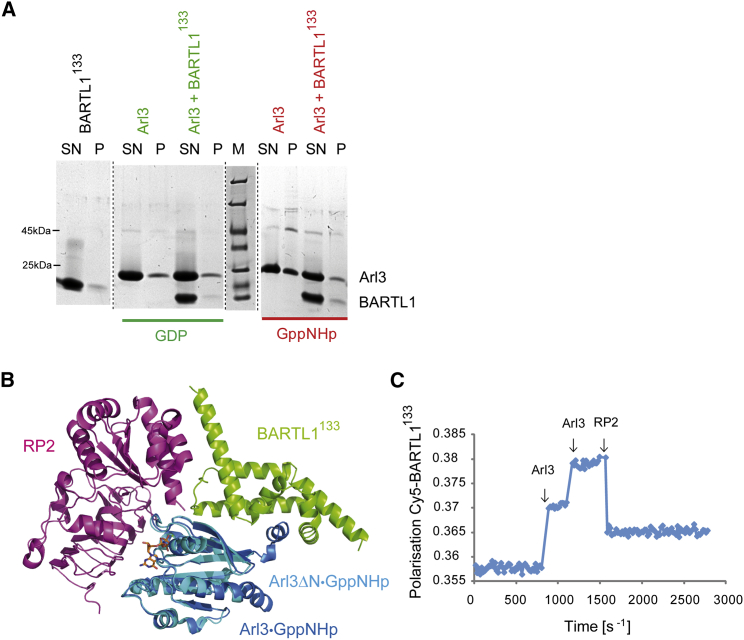
Cilia are small antenna-like cellular protrusions critical for many developmental signaling pathways. The ciliary protein Arl3 has been shown to act as a specific release factor for myristoylated and farnesylated ciliary cargo molecules by binding to the effectors Unc119 and PDE6δ. Here we describe a newly identified Arl3 binding partner, CCDC104/CFAP36. Biochemical and structural analyses reveal that the protein contains a BART-like domain and is called BARTL1. It recognizes an LLxILxxL motif at the N-terminal amphipathic helix of Arl3, which is crucial for the interaction with the BART-like domain but also for the ciliary localization of Arl3 itself. These results seem to suggest a ciliary role of BARTL1, and possibly link it to the Arl3 transport network. We thus speculate on a regulatory mechanism whereby BARTL1 aids the presentation of active Arl3 to its GTPase-activating protein RP2 or hinders Arl3 membrane binding in the area of the transition zone.


Figures

None
Graphical abstract
Figure 1
Figure 1
Domain Organization and Secondary Structure of BARTL1 (A) Domain organization of human BART and human BARTL1 with amino acid boundaries of the BART-like domain (green), random coiled coil (gray), and further α helices (red). (B) Alignment of residues 1–133, comprising the BART-like domain, from Homo sapiens (Hs) and Mus musculus (Mm) BART and BARTL1. Dependent on their degree of conservation, residues are colored from red (highly conserved) to blue (non-conserved). The α helices of the BART-like domain are indicated above.
Figure 2
Figure 2
Localization of Arl2, Arl3, and BARTL1 in IMCD3 Cells with Induced Cilia (A) Stably expressed, C-terminally GFP-tagged full-length mouse Arl3 or Arl2 in IMCD3 Flp-In cells were serum-starved and fixed. Apart from GFP labeling (shown in all the following figures, as indicated), the cells were immunostained for acetylated α-tubulin (AcTub) and the nucleus (DAPI). Boxed areas show enlargement of cilia. White arrows point to the base of the cilium. (B) IMCD3 Flp-In cells stably expressing Arl3-GFP were stained for γ-tubulin (αγ-Tub; blue) and Arl13B (αArl13B; red). Indicated are basal body (blue arrow) and the GFP signal between basal body and Arl13B signal (white arrow). The boxed area in the upper row (left panel) is enlarged in the lower row. (C) IMCD3 Flp-In cells stably expressing C-terminally tagged human BARTL1-GFP and mouse BARTL1133-GFP were serum-starved, fixed, and immunostained for acetylated α-tubulin (AcTub) and the nucleus (DAPI). Boxed areas show enlargement of cilia. (D) IMCD3 Flp-In cells stably expressing BARTL1-GFP were stained for γ-tubulin (αγ-Tub; blue) and Arl13B (αArl13B; red). Indicated are basal body (blue arrow) and the GFP signal between basal body and Arl13B signal (white arrow). The boxed area in the upper row (left panel) is enlarged in the lower row. Scale bars represent 5 μm.
Figure 3
Figure 3
Biochemical Characterization of the BARTL1∙Arl Interaction (A) Analytical size-exclusion chromatography (Superdex75 10/300Gl). Elution profiles of BARTL1 full-length (green, left) or BARTL1133 (green, right) alone or mixed with Arl3 full-length bound to GDP (black) or GppNHp (red) as indicated. Elution profile of Arl3 alone is shown in blue. Elution fractions were analyzed by SDS-PAGE and Coomassie staining as shown below the graphs. (B) Determination of dissociation constants (KD) by fluorescence polarization measurements at 20°C in buffer M. 1 μM Arl3 or Arl2 full-length bound to mant-GppNHp were titrated with increasing amounts of BARTL1 full-length or BARTL1133. Fitting to a quadratic equation gives the dissociation constants (and standard deviations) shown in the table below the graph. (C) Stopped-flow fluorescence polarization at 20°C in buffer M. A preformed complex of 1 μM FITC-BARTL1133 with 2 μM Arl3-GppNHp was shot together with a 50-fold excess of unlabeled BARTL1133. The curve was fitted to a single exponential to determine the koff rate (and SD), which is given below the graph.
Figure 4
Figure 4
Structure of the Arl3∙GppNHp∙BARTL1133 Complex (A) Overview (left) and zoom-in of the interaction area 1 (right), with N-terminal helix of Arl3 (blue) buried in a hydrophobic groove of BARTL1133 (green). Zoom-in of interaction area 2 (below) shows BARTL1133 contacting switches I (red) and II (purple) of Arl3. α Helices of BARTL1133are numbered. (B) Schematic overview of residues from BARTL1133 (green) and Arl3 (blue) involved in the interaction: hydrophobic van der Waals interactions (solid black lines) involving the side chains of the residues indicated, H bonds (red dotted lines), and salt bridges (gray dotted lines). H bonds to backbone oxygen or nitrogen of residues are indicated by BO or BN, respectively. Distances are indicated in angstroms. (C) Alignment of N terminus of Arl3 from different organisms, Homo sapiens (Hs), Mus musculus (Mm), Rattus norvegicus (Rn), Xenopus laevis (Xl), Bos taurus (Bt), Danio rerio (Dr), Caenorhabditis elegans (Ce), and Chlamydomonas rheinhardtii (Cr), shows that the N-terminal hydrophobic LLxILxxL motif is highly conserved in Arl3. Amino acids are colored according to the residue identity. Hydrophobic residues are shown in green.
Figure 5
Figure 5
Biochemical Characterization of the Interface of the Arl3∙GppNHp∙BARTL1133 Complex and Comparison with Arl2∙GTP∙BART (A) Pull-down of GST-BARTL1133 wild-type by either wild-type or mutant Arl3-His bound to Talon beads. (B) Pull-down of GST-BARTL1133 wild-type or mutants by Arl3-His bound to Talon beads. (C) Interaction area 1 (upper) as in Figure 3A from the BARTL1133 (green) or BART (red) complexes obtained by superimposing the N-terminal helices of Arl3 (blue) with Arl2 (orange), respectively; interaction area 2 (below) as in Figure 3A, obtained by superimposition of Arl2 and Arl3, shows contact of switches I (red) and II (purple) of Arl3 or Arl2, with BARTL1133 or BART, respectively. (D) Schematic overview of residues from BART (red) and Arl2 (orange) involved in the interaction interface as described in Figure 4B.
Figure 6
Figure 6
N-Terminal Helix of Arl3 is Crucial for the Interaction with BARTL1 (A) Analytical size-exclusion chromatography (Superdex75 10/300Gl) of BARTL1 alone (green) or mixed with Arl3ΔN bound to GDP (black) or GppNHp (red) as indicated. Elution fractions were analyzed by SDS-PAGE and Coomassie staining as shown below the graph. (B) Determination of dissociation constants (KD) by fluorescence polarization measurements at 20°C in buffer M. 200 nM Cy5-BARTL1133 was titrated with increasing amounts of Arl3WT, Arl3L4D, Arl3F51A, Arl3ΔN, and Arl2WT. Fitting to a quadratic equation gives the dissociation constants (and SDs) shown in the table below the graph.
Figure 7
Figure 7
Localization of Arl3 Mutants in IMCD3 Cells and Knockdown of Arl3 and BARTL1, Using the Presentation Scheme as Explained in Figure 2 (A) Stably expressed, C-terminally GFP-tagged mouse Arl3ΔN, Arl23Nterm, Arl3L4D, and Arl3F51A in IMCD3 Flp-In cells were immunostained for acetylated α-tubulin (AcTub) and the nucleus (DAPI) as indicated. (B) Transient knockdown of BARTL1 in IMCD3 Flp-In cells stably expressing Arl3-GFP (upper panels) and knockdown of Arl3 in cells stably expressing BARTL1-GFP (lower panels). The efficiency of knockdown was analyzed by western blot of cell lysates, and is shown in Figure S4.
Figure 8
Figure 8
Investigation into Possible Function of BARTL1 (A) Liposome sedimentation assay. 2.8 mM of 200-μm liposomes of DOPC/DOPG/DPPC/DPPG/cholesterol composition were incubated with 20 μM Arl3 bound to GDP or GppNHp in the presence of 40 μM BARTL1133. Aliquots of the supernatant (SN) and pellet (P) compared with the marker (M) following sedimentation were analyzed by SDS-PAGE. (B) Overlay of Arl3∙GppNHp∙RP2 (PDB: 3BH6) with Arl3∙GppNHp∙BARTL1133 (PDB: 4ZI2). (C) Fluorescence polarization measurements at 20°C in buffer M: 1 μM Cy5-BARTL1133 was titrated twice with 1 μM Arl3∙GppNHp, followed by addition of 10 μM RP2 (as indicated by arrows).

Similar articles

Cited by

References

    1. Avidor-Reiss T., Maer A.M., Koundakjian E., Polyanovsky A., Keil T., Subramaniam S., Zuker C.S. Decoding cilia function: defining specialized genes required for compartmentalized cilia biogenesis. Cell. 2004;117:527–539. - PubMed
    1. Berken A., Thomas C., Wittinghofer A. A new family of RhoGEFs activates the Rop molecular switch in plants. Nature. 2005;436:1176–1180. - PubMed
    1. Bhamidipati A., Lewis S.A., Cowan N.J. ADP ribosylation factor-like protein 2 (Arl2) regulates the interaction of tubulin-folding cofactor D with native tubulin. J. Cell Biol. 2000;149:1087–1096. - PMC - PubMed
    1. Cantagrel V., Silhavy J.L., Bielas S.L., Swistun D., Marsh S.E., Bertrand J.Y., Audollent S., Attié-Bitach T., Holden K.R., Dobyns W.B. Mutations in the cilia gene ARL13B lead to the classical form of Joubert syndrome. Am. J. Hum. Genet. 2008;83:170–179. - PMC - PubMed
    1. Chandra A., Grecco H.E., Pisupati V., Perera D., Cassidy L., Skoulidis F., Ismail S.A., Hedberg C., Hanzal-Bayer M., Venkitaraman A.R. The GDI-like solubilizing factor PDEδ sustains the spatial organization and signalling of Ras family proteins. Nat. Cell Biol. 2012;14:148–158. - PubMed

Publication types

Substances