. 2015 Aug;17(8):671-84.
doi: 10.1016/j.neo.2015.08.005.

Metabolic plasticity of metastatic breast cancer cells: adaptation to changes in the microenvironment

Affiliations

Metabolic plasticity of metastatic breast cancer cells: adaptation to changes in the microenvironment

Rui V Simões et al. Neoplasia. 2015 Aug.

Abstract

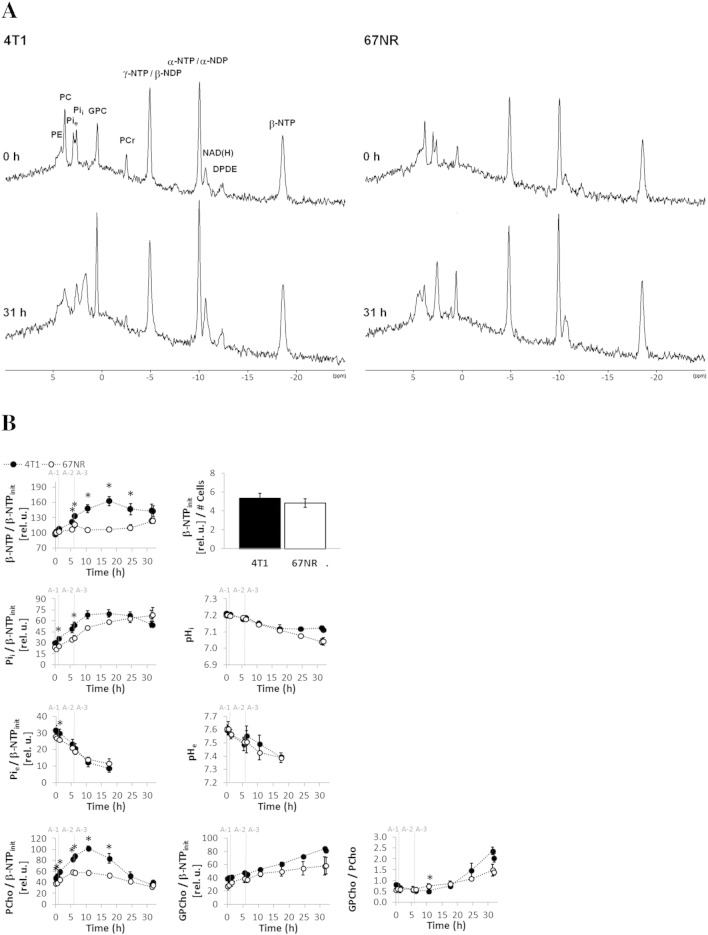
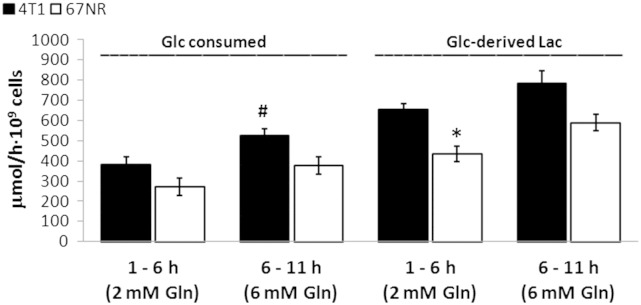
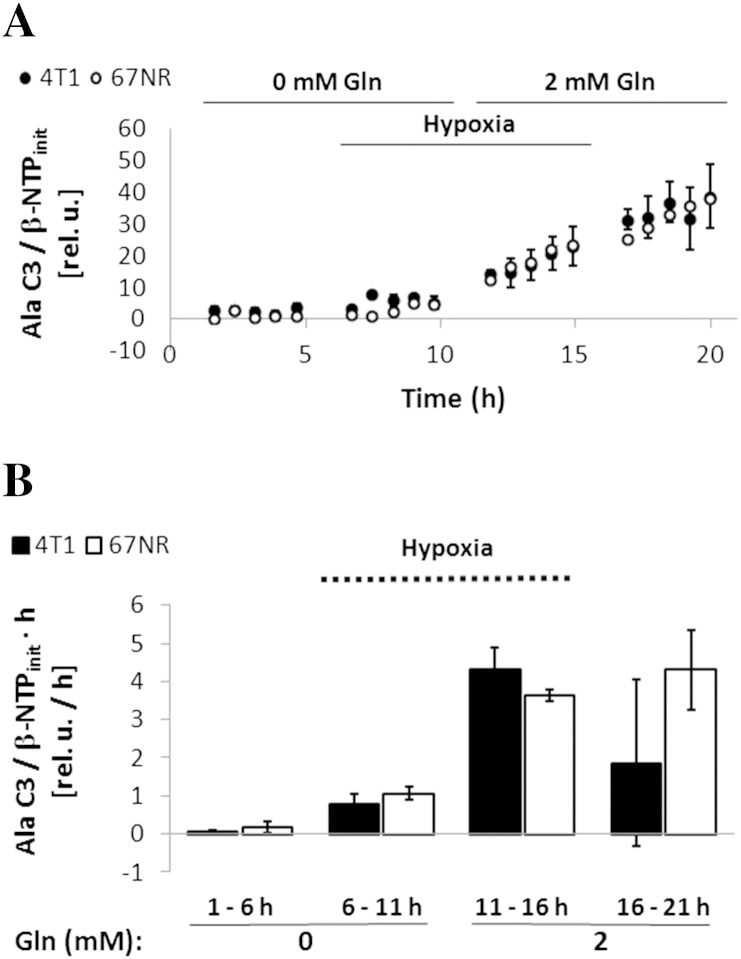
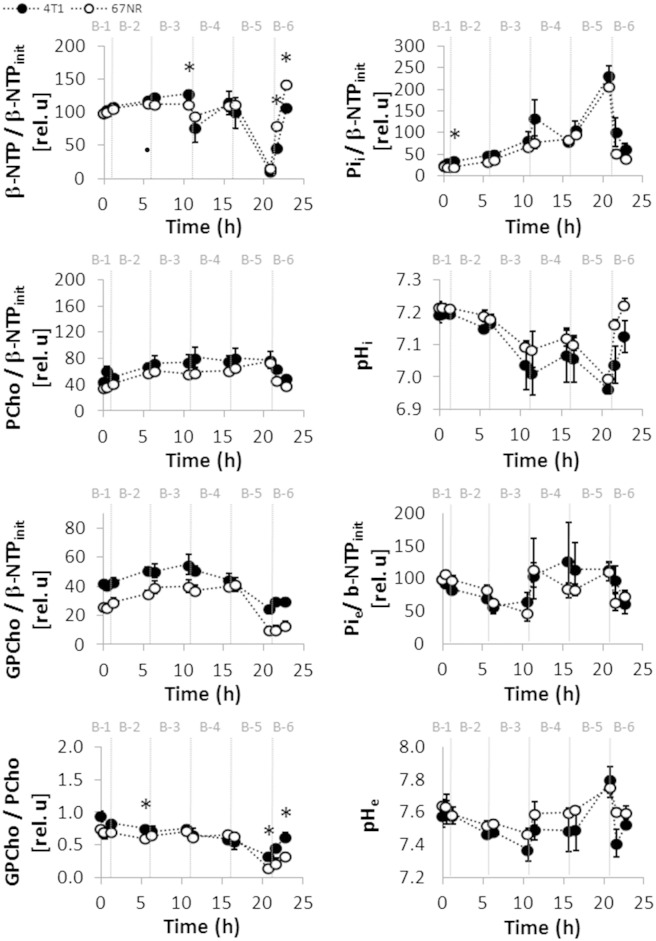
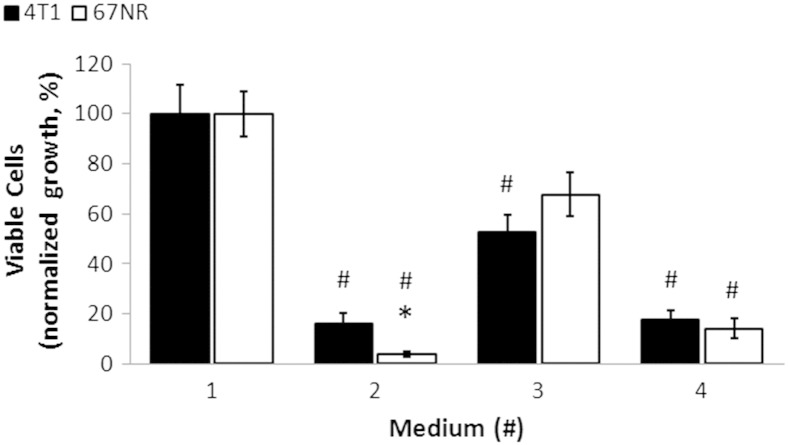
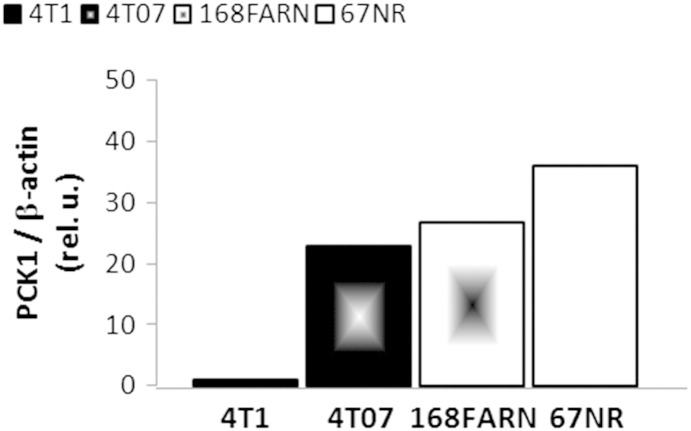
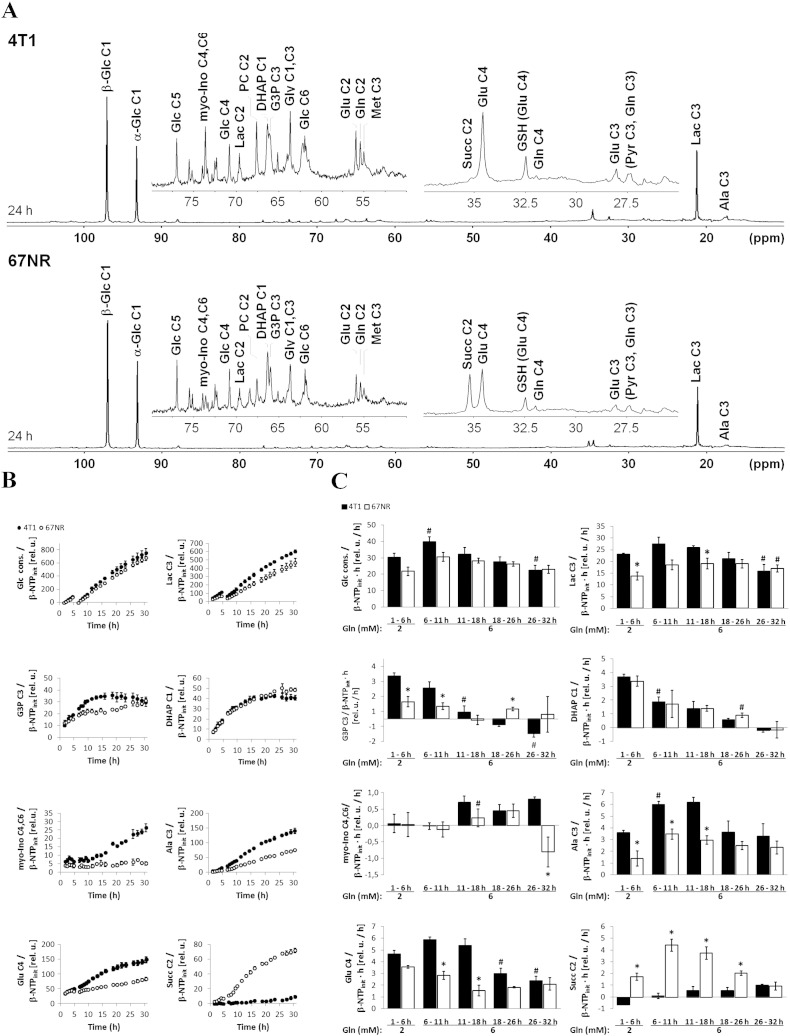
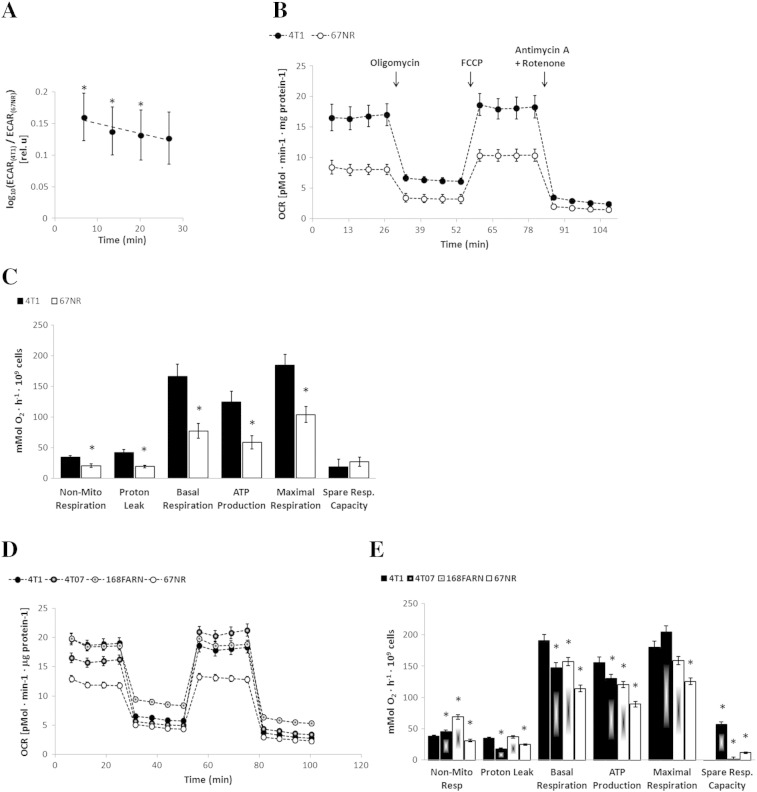
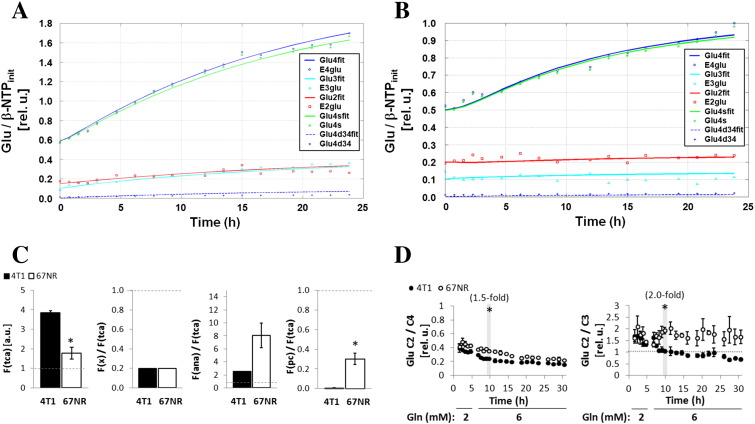
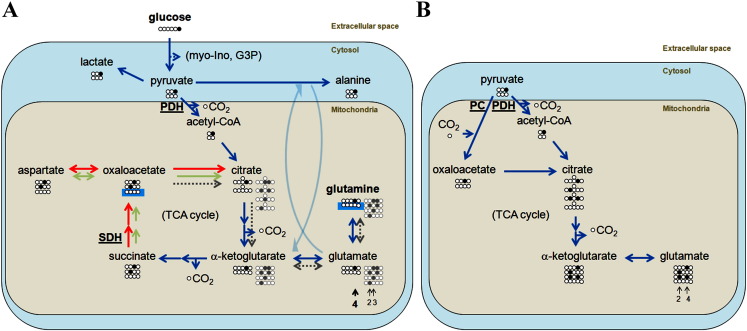
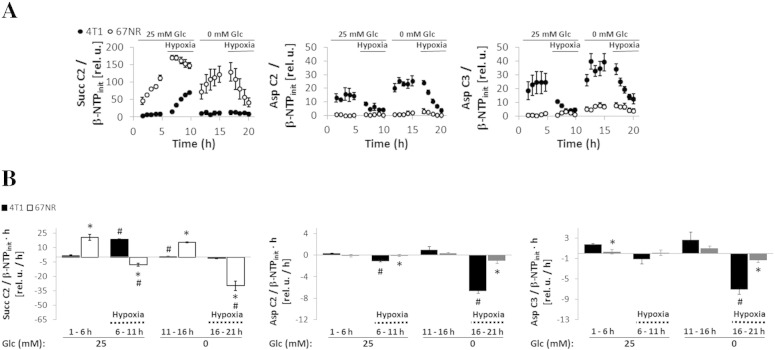
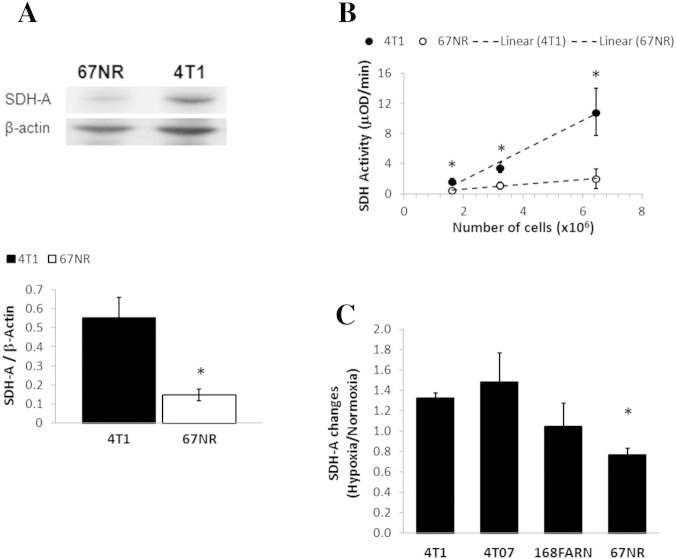
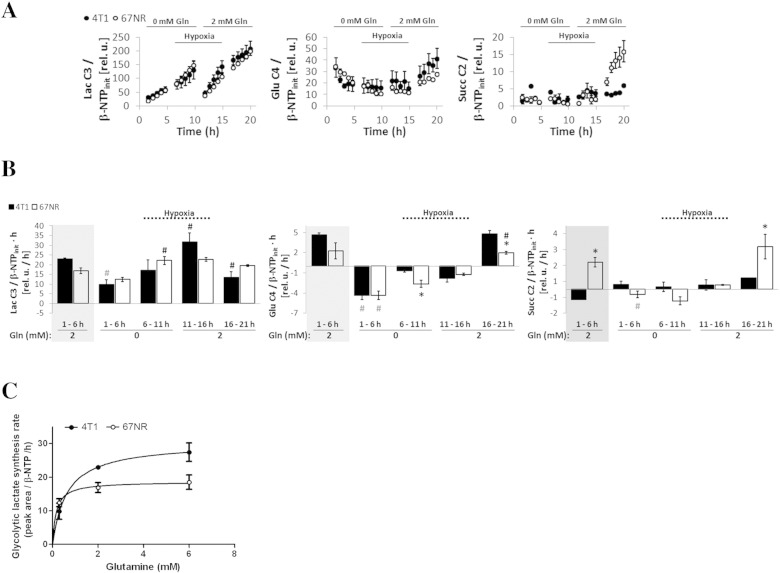
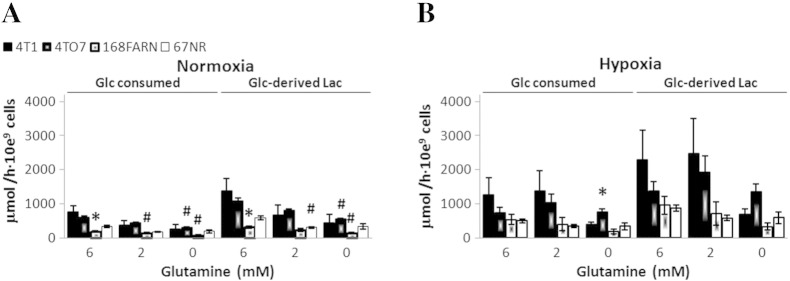
Cancer cells adapt their metabolism during tumorigenesis. We studied two isogenic breast cancer cells lines (highly metastatic 4T1; nonmetastatic 67NR) to identify differences in their glucose and glutamine metabolism in response to metabolic and environmental stress. Dynamic magnetic resonance spectroscopy of (13)C-isotopomers showed that 4T1 cells have higher glycolytic and tricarboxylic acid (TCA) cycle flux than 67NR cells and readily switch between glycolysis and oxidative phosphorylation (OXPHOS) in response to different extracellular environments. OXPHOS activity increased with metastatic potential in isogenic cell lines derived from the same primary breast cancer: 4T1 > 4T07 and 168FARN (local micrometastasis only) > 67NR. We observed a restricted TCA cycle flux at the succinate dehydrogenase step in 67NR cells (but not in 4T1 cells), leading to succinate accumulation and hindering OXPHOS. In the four isogenic cell lines, environmental stresses modulated succinate dehydrogenase subunit A expression according to metastatic potential. Moreover, glucose-derived lactate production was more glutamine dependent in cell lines with higher metastatic potential. These studies show clear differences in TCA cycle metabolism between 4T1 and 67NR breast cancer cells. They indicate that metastases-forming 4T1 cells are more adept at adjusting their metabolism in response to environmental stress than isogenic, nonmetastatic 67NR cells. We suggest that the metabolic plasticity and adaptability are more important to the metastatic breast cancer phenotype than rapid cell proliferation alone, which could 1) provide a new biomarker for early detection of this phenotype, possibly at the time of diagnosis, and 2) lead to new treatment strategies of metastatic breast cancer by targeting mitochondrial metabolism.


Figures

Figure S1
Figure S1
Dynamic bioenergetic profile, pH, and phospholipid metabolism of live 4T1 and 67NR cells. The cells were studied dynamically for 31 hours in an MR-compatible cell perfusion system as described in Table 1, Study A (corresponding to 13C MR studies in Figure 1). (A) Representative 1D 31P MR spectra acquired from 4T1 (left side) and from 67NR (right side) cells, each before (top) at baseline and after (bottom) perfusion with 1-13C-glucose at the end of the experiment. Peak assignments are shown in the top-left spectrum: Phosphoethanolamine (PE), phosphocholine (PCho), extracellular inorganic phosphate (Pie), intracellular inorganic phosphate (Pii), glycerophosphocholine (GPCho), phosphocreating (PCr), nucleoside diphosphate (NDP), nucleoside triphosphate (NTP), overlapping signals from the nicotinamide adenine dinucleotides NAD +/NADH and NADP +/NADPH [NAD(H)], diphosphodiester (DPDE). All spectra are displayed with 30-Hz exponential line broadening. (B) Time-course changes for β-NTP (mostly ATP supp), Pii, Pie, PCho, and GPCho normalized to β-NTPinit are shown on the left, from top to bottom. Right column from top to bottom: Initial β-NTP (β-NTPinit) from 31P MRS normalized to the number of cells—determined by Crystal Violet nuclei counting , supp—at time of loading of the cells; pHi and pHe, determined from the chemical shift of the corresponding Pii and Pie signals , supp; GPCho/PCho ratio. β-NTPinit (β-NTP at time 0 hour), as a fraction of the initial number of cells when loading the cell perfusion system, was similar between the two cell lines. Whereas 67NR cells demonstrate slightly increasing β-NTP levels over the entire time, in 4T1 cells, β-NTP increases up to 1.7-fold (of β-NTPinit) within the first 18 hours and plateaus from 18 to 32 hours. At that point, 4T1 cells (initially > 70% confluent on the microcarriers) had time to double in the 3D cell perfusion system and therefore are close to or have likely reached confluence, resulting in the plateau of their β-NTP. These observations indicate that the changes observed in the energy status between these two cell lines during the first 15 hours of the cell perfusion experiments may be attributable to their differences in cell proliferation, as has been observed previously with a glioma cell line , , supp. During the cell perfusion experiments, both 4T1 and 67NR cells produce and accumulate PCho in the first 11 hours, 4T1 cells (two-fold increase) significantly more so than 67NR cells (1.5-fold increase), consistent with the metastatic phenotype and faster proliferation of 4T1 cells as observed previously for other tumor cell lines , , supp. Cellular GPCho levels increased significantly in both cell lines; the slight differences between 4T1 and 67NR cells were not significant. The GPCho/PCho ratio, which has been associated with slower proliferation in breast cancer cell lines and human patient samples supp, decreased in 4T1 cells during the first 11 hours of perfusion (Table S1), and an upward trend after that time was noted, both agreeing with the shorter cell doubling time of 4T1 than 67NR cells and the respective changes detected in β-NTP. Beyond 18 hours, pHi plateaus in 4T1 cells while still continuing to decrease in 67NR cells. Because at these later time points the Pie signal decreased to levels at which it could not be resolved from the Pii signal, pHe could not be resolved from pHi. Average values (mean ± SEM, n = 3 each) are shown for 4T1 (closed circles) and 67NR cells (open circles). Significant differences (P < .05, unpaired t test) between 4T1 and 67NR cells are denoted by *. The statistical significance for the same cell line between different time points (P < .05, paired t test) are shown in Table S1, Study A.
Figure S2
Figure S2
Absolute rates of 1-13C-glucose consumption and de novo 1-13C-glucose–derived lactate synthesis in 4T1 and 67NR cells. Average values (n = 3) determined from the cell perfusion data shown in Figure 1 during the initial 10-hour perfusion with 2 mM (1-6 hours) and 6 mM (6-11 hours) glutamine-containing media. Metabolite concentrations at the two time points were calculated based on concentrations determined from medium samples collected at the end of each experiment (32 hours), as detailed in supplemental experimental procedures. *Statistically significant differences between cell lines during the same time interval (P < .05, unpaired t test); #statistically significant change versus previous interval for the same cell line (P < .05, paired t test). Error bars indicate the standard error of the means.
Figure S3
Figure S3
Labeling of alanine-C3 with 13C in cell perfusion stress studies with 1-13C-glucose. Normalized average time-course changes of alanine-C3 (A) and respective 13C-labeling rates at different time intervals (B), determined from 13C MR spectra, in response to environmental conditions as detailed in Table 1 (Study C). Error bars indicate the standard error of the means. Open circles: 67NR, closed circles: 4T1.
Figure S4
Figure S4
Bioenergetic profile, pH, and phospholipid metabolism of 4T1 and 67NR cells during the cell perfusion stress studies B, detailed in Table 1. Time-course changes of β-NTP, intracellular (i) and extracellular (e) Pi and pH, PCho, GPCho, and GPCho/PCho for the studies with 3-13C-glutamine (corresponding to 13C MR studies in Figure 5). The different stages detailed in Table 1 are indicated in each plot and separated by dashed lines. Error bars indicate the standard error of the means. *Statistically significant differences between 4T1 and 67NR cells during the same time interval (P < .05, unpaired t test). Statistically significant changes (P < .05, paired t test) between different time points for the same cell line are shown in Table S1 (Study B, with 3-13C-glutamine).
Figure S5
Figure S5
Effects of environmental stresses on cell growth. In vitro cell growth response of 4T1 and 67NR cells to 48-hour exposure to different metabolite stresses (media: #2, 25 mM Glc and 0 mM Gln; #3, 25 mM Glc and 2 mM Gln; #4, 0 mM Glc and 6 mM Gln) as percentage of standard tissue culture conditions (medium #1, 25 mM Glc and 6 mM Gln). Cells were all grown in 20% O2/5% CO2 at 37°C. Error bars indicate the standard error of the means (n = 5 for each condition). #Significant differences of cell growth for stress versus standard tissue culture conditions (100%) for each cell line (P < .05, paired t Test). *Significant differences of cell growth between cell lines under the same culture conditions (P < .05, unpaired t test).
Figure S6
Figure S6
Bioenergetic profile, pH, and phospholipid metabolism of 4T1 and 67NR cells during the cell perfusion stress studies C, detailed in Table 1. Time-course changes of β-NTP, intracellular (i) and extracellular (e) Pi and pH, PCho, GPCho, and GPCho/PCho for the studies with 1-13C-glucose (corresponding to 13C MR studies in Figure 7). The different stages detailed in Table 1 are indicated in each plot and separated by dashed lines. Error bars indicate the standard error of the means. *Statistically significant differences between 4T1 and 67NR cells during the same time interval (P < .05, unpaired t test). Statistically significant changes (P < .05, paired t test) between different time points for the same cell line are shown in Table S1 (study C, with 1-13C-glucose).
Figure S7
Figure S7
Protein expression of PCK1 in four isogenic cell lines: 4T1, 4 T07, 168FARN, and 67NR. 105 cells were seeded on six-well plates and grown for 3 days, at which point they were harvested and counted. Cells were then used to assess the expression of PCK1 (monoclonal antibody #12940; Cell Signaling Technology, Danvers, MA) following the same Western blot protocol described in the “Methods” section for SDH-A. The preliminary results are from a single experiment.
Figure 1
Figure 1
Basal glucose metabolism of live 4T1 and 67NR cells. MR cell perfusion studies (n = 3 for each cell line). (A) Representative nuclear Overhauser effect–enhanced, 1D 1H-decoupled 13C MR spectra acquired from 4T1 (top) and 67NR (bottom) cells after 24-hour perfusion with culture medium containing 1-13C-glucose (Glc), as detailed in Study A, Table 1. The regions from 80 to 50 ppm and 40 to 25 ppm are shown enlarged above the full spectra. All spectra are displayed with 10-Hz exponential line broadening. Signal assignments of metabolites, with C1-6 depicting the position of the incorporated 13C label: alanine (Ala), dihydroxyacetone phosphate (DHAP), α- and β-glucose (α-Glc and β-Glc, respectively), glutamate (Glu), glutamine (Gln), glutathione (GSH-Glu), glycerol (Gly), glycerol-3-phosphate (G3P), lactate (Lac), methionine (Met), myo-inositol (myo-Ino), pyruvate (Pyr), succinate (Succ). (B) Average time-course changes for the major peak areas, normalized to the initial β-NTP values (β-NTPinit, determined from 31P MRS; Figure S1). (C) Average 13C-labeling rates of metabolites at different time intervals for the data shown in B.
Figure 2
Figure 2
Mitochondrial respiration of breast cancer cells with different metastatic potential. Extracellular flux analyzer experiments (Seahorse Bioscience XF96) for different cell lines using XF assay medium containing 25 mM glucose and 6 mM glutamine: 4T1 and 67NR: n = 4 (A–C); 4T1, 4T07, 168FARN, and 67NR: n = 1 (D–E). (A) The logarithm of ratios of ECARs (mpH · min− 1 · mg protein− 1) of 4T1 and 67NR cells, ECAR(4T1)/ECAR(67NR), plotted repeatedly over 27 minutes. (B) OCR (pMol · min− 1 · mg protein− 1) measurements for 4T1 and 67NR cells, respectively. (C) For 4T1 and 67NR cells, the following mitochondrial respiration parameters were calculated from the OCR curves shown in B: nonmitochondrial respiration, proton leak, basal respiration, ATP production, maximal respiration, and spare respiratory capacity. An additional experiment, performed as described for B and C, included four isogenic cell lines and is shown in D and E, respectively. In A, * indicates significant differences between 4T1 and 67NR cells at successive time points (P = .021, .023, .041, and .05, respectively) and for the geometric mean across time points (P = .034) based on one-sample t tests of the log-ratios across experimental replicates.
Figure 3
Figure 3
TCA cycle flux analysis of 4T1 and 67NR cells. Representative examples of flux fitting for 4T1 (A) and 67NR (B) cells during the 6- to 32-hour perfusion period with 99% 1-13C-Glc and 6 mM glutamine based on the time courses of labeled glutamate isotopomers C4 (E4glu), C3 (E3glu), and C2 (E2glu), and the estimated glutamate C4 singlet (Glu4s, 98%) and doublet (after one turn of the TCA cycle: Glu4d34, 2%). The solid lines are the fits of the kinetic model to the data. Dashed lines are the predicted Glu4d34 from the model. (C) From left to right: estimations of TCA cycle flux [F(tca)], α-ketoglutarate to glutamate flux [F(x)] relative to F(tca), anaplerotic flux [F(ana), total exchange estimated at the levels of succinyl-CoA, fumarate, and OAA; center panel] relative to F(tca), and pyruvate carboxylase flux [F(pc) relative to F(tca)]. (D) Experimental time-course data for 4T1 and 67NR cells illustrate the relative fluxes estimated by the model (shown in C) in presence of 2 mM glutamine (1-6 hours) and 6 mM glutamine (6-32 hours): left panel, Glu C2/C4 ratios; right panel, Glu C2/C3 ratios. Significantly higher Glu C2/C4 and Glu C2/C3 ratios in 67NR than 4T1 cells, indicative of a higher F(pc)/F(tca) and F(ana)/F(tca), respectively.
Figure 4
Figure 4
Metabolic model for 4T1 and 67NR cells. (A) Extracellular 1-13C-Glc (carbons C1-6 shown as spheres; 13C-labeled carbon in black) in the medium is taken up by the cells via GLUT transporters. Glucose is then metabolized through the glycolytic pathway, labeling 50% of the de novo pools of myo-inositol (C2, C4), DHAP (C1), and glycerol-3-phosphate (C1), which could be detected in the cell perfusion system experiments (Figure 1). Pyruvate (C3 labeling) can be further metabolized in the cytosol to lactate (C3 labeling), regenerating the NAD+ consumed during glycolysis, or to alanine (C3 labeling) by transamination of glutamate with pyruvate. Alternatively, pyruvate can be channeled to the mitochondria and converted to acetyl-CoA (C2 labeling) via pyruvate dehydrogenase (PDH). Acetyl-CoA enters the TCA cycle and condenses with OAA (initial unlabeled pool) to produce citrate, which then transfers its label to α-ketoglutarate (C4). The exchange between α-ketoglutarate (fast turnover) and glutamate (C4 labeling) makes the latter a marker of TCA cycle activity. The C4 label of α-ketoglutarate is then transferred to succinate C2 (or C3; not distinguishable) and then to OAA C2 (C3). Because succinate C2 (C3) accumulates in 67NR cells, it is likely that their TCA cycle is restricted at the level of SDH, leading to lower flux to OAA (green arrows; higher flux expected in 4T1 cells, displayed by red arrows). After this first turn of the TCA cycle, a significant part of the intermediates has been removed for biosynthetic purposes; the remaining OAA can be used for the second turn — reactions indicated by the dotted gray arrows and the resulting molecules by the gray spheres (13C label, gray; unlabeled, white). In this case, the resulting labeling pattern of glutamate is more complex and generates an additional 1:1 pool of C2 and C3 labeling (highlighted by short gray arrows). (B) Besides PDH, an alternative way for pyruvate to enter the TCA cycle is through pyruvate carboxylase (PC). This anaplerotic pathway becomes more important when glutamine is not sufficiently available to cells or they cannot use it to regenerate OAA. In this case, the first turn of the TCA cycle will generate a 1:1 labeling of glutamate in positions C4 and C2 (indicated by short gray arrows).
Figure 5
Figure 5
Cell perfusion stress studies with 3-13C-glutamine. Normalized average time-course changes of metabolite levels (A) and 13C-labeling rates at different time intervals (B) for succinate C2, aspartate C2, and aspartate C3 determined from 13C MR spectra under environmental conditions as detailed in Table 1 (Study B).
Figure 6
Figure 6
SDH expression and activity in breast cancer cells with different metastatic potential. (A) Protein expression of SDH-A was higher in 4T1 than 67NR cells, as shown in a representative Western blot of 4T1 and 67NR cells (left panel) and quantified by averaging the SDH-A/β-actin ratios over three independent experiments (right, bar graph). (B) SDH activity assessed kinetically by absorbance spectroscopy at 600 nm in 4T1 and 67NR cells (dots are average values of at least three independent experiments) and linear fittings for each cell line (slope = SDH activity): 4T1, 1.97 ± 0.28 (R2 = 0.98); 67NR, 0.32 ± 0.03 (R2 = 0.99). (C) Ratio of cellular SDH-A/β-actin expression in hypoxia to normoxia for 4T1, 4T07, 168FARN, and 67NR cell lines exposed to culture medium containing 25 mM Glc and 6 mM Gln.
Figure 7
Figure 7
Cell perfusion stress studies with 1-13C-glucose as detailed in Table 1 (Study C). Normalized average time-course changes (A) and labeling rates at different time intervals (B) of lactate C3, glutamate C4, and succinate C2 as determined from 13C MR spectra. In B, the rates in the gray boxes are from the experiments shown in Figure 1C and displayed again for comparison. (C) The values obtained from experiments C-2, A-2, and A-3 (detailed in Table 1) and displayed in A (1-6 hours, 0 mM Gln) and Figure 1C (1-6 hours, 2 mM Gln; and 6-11 hours, 6 mM Gln) were fitted according to the Michaelis-Menten asymptotic model. Because the cellular washout of glutamine is slow (data not shown), when changing from 6 mM to 0 mM glutamine-containing perfusion media, a 5% residual level of glutamine (0.3 mM) was estimated in the cell microenvironment at the beginning of the study. Error bars indicate the standard error of the means.
Figure 8
Figure 8
Absolute rates of 1-13C-glucose consumption and de novo 1-13C-glucose–derived lactate synthesis in breast cancer cells of different metastatic potential and under different stresses. Each cell line was incubated with 1-13C-glucose for 5 hours, either in 20% O2 (A) or in 1% O2 (B), and TCM2D samples were collected for high-resolution 13C-MR studies. Extracellular 1-13C-glucose consumption and 1-13C-glucose–derived lactate synthesis rates were averaged over three independent experiments for each condition. # Statistically significant change with respect to same cell line in medium containing 6 mM Gln.

Similar articles

Cited by

References

    1. Siegel R, DeSantis C, Virgo K, Stein K, Mariotto A, Smith T, Cooper D, Gansler T, Lerro C, Fedewa S. Cancer treatment and survivorship statistics, 2012. CA Cancer J Clin. 2012;62:220–241. - PubMed
    1. Chiang AC, Massague J. Molecular basis of metastasis. N Engl J Med. 2008;359:2814–2823. - PMC - PubMed
    1. Fidler IJ, Kripke ML. Metastasis results from preexisting variant cells within a malignant tumor. Science. 1977;197:893–895. - PubMed
    1. Bianchini G, Qi Y, Alvarez RH, Iwamoto T, Coutant C, Ibrahim NK, Valero V, Cristofanilli M, Green MC, Radvanyi L. Molecular anatomy of breast cancer stroma and its prognostic value in estrogen receptor-positive and -negative cancers. J Clin Oncol. 2010;28:4316–4323. - PubMed
    1. Rattigan YI, Patel BB, Ackerstaff E, Sukenick G, Koutcher JA, Glod JW, Banerjee D. Lactate is a mediator of metabolic cooperation between stromal carcinoma associated fibroblasts and glycolytic tumor cells in the tumor microenvironment. Exp Cell Res. 2012;318:326–335. - PMC - PubMed

Publication types

MeSH terms

LinkOut - more resources