. 2015 Sep 25;10(9):e0139076.
doi: 10.1371/journal.pone.0139076. eCollection 2015.

Embryonic Stem Cell Growth Factors Regulate eIF2α Phosphorylation

Affiliations

Embryonic Stem Cell Growth Factors Regulate eIF2α Phosphorylation

Kyle Friend et al. PLoS One. .

Abstract

Growth factors and transcription factors are well known to regulate pluripotent stem cells, but less is known about translational control in stem cells. Here, we use embryonic stem cells (ESCs) to investigate a connection between ESC growth factors and eIF2α-mediated translational control (eIF2α phosphorylation promotes protein expression from mRNAs with upstream open-reading frames, or uORFs). We find abundant phosphorylated P-eIF2α (P-eIF2α) in both pluripotent mouse and human ESCs, but little P-eIF2α in ESCs triggered to differentiate. We show that the growth factors LIF (leukemia inhibitory factor) and BMP4 (bone morphogenic protein 4) both maintain P-eIF2α in mESCs, but use distinct mechanisms: LIF inhibits an eIF2α phosphatase whereas BMP4 activates an eIF2α kinase. The mRNAs encoding the pluripotency factors Nanog and c-Myc possess uORFs while Oct4 mRNA does not. We find that salubrinal, a chemical that increases eIF2α phosphorylation, promotes Nanog and c-Myc expression, but not Oct4 expression. These experiments connect ESC growth factors to eIF2α phosphorylation and suggest a chemical substitute for LIF to enhance Nanog and c-Myc expression.


Conflict of interest statement

Competing Interests: The authors have declared that no competing interests exist.

Figures

Fig 1
Fig 1. Phosphorylated eIF2α and eIF4G in mESCs and hESCs.
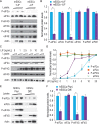
(A) mESCs were cultured either with LIF (mESCs +LIF) or without LIF for 24 h (mESCs–LIF). Increasing amounts of cell lysate (indicated by triangles) were separated by 4–12% gradient SDS-PAGE and indicated proteins visualized by western blot. P-eIF2α, P-eIF4G and P-eIF4E, phosphorylated eukaryotic translation initiation factors; eIF2α, eIF4G and eIF4E, total eukaryotic translation initiation factors. Actin was probed as a loading control. (B) Three biological replicates, prepared as in (A), were quantitated. Data were normalized to values from mESCs cultured with LIF (mESCs +LIF). Both P-eIF2α and P-eIF4G are downregulated in mESCs cultured without LIF, whereas P-eIF4E is unchanged. Error bars represent s.d. (*, p < 0.01 compared to mESCs +LIF samples). (C) mESCs were cultured for 24 h with various concentrations of LIF (10 ng/mL is standard); increasing amounts of cell lysate (indicated by triangles) were separated by SDS-PAGE and analyzed by western blot for indicated proteins. (D) Three biological replicates, prepared as in (C), were quantitated. Data were normalized to values from mESCs cultured with 20 ng/mL LIF. Increasing LIF promotes increasing phosphorylation of eIF2α and eIF4G. Note that LIF titration promotes eIF4G phosphorylation prior to eIF2α phosphorylation. Error bars represent s.d. (*, p < 0.01 compared to 10 ng/mL LIF samples). (E) hESCs were cultured for 24 h with FGF2 and TGF-β (hESCs Pluri.) or under conditions that induce mesendoderm differentiation (hESCs Diff.). Increasing amounts of cellular lysate (indicated by triangles) were separated by SDS-PAGE and western blotted for indicated proteins. (F) Three biological replicates, prepared as in (E), were quantitated. Data were normalized to values from hESCs cultured with FGF2 and TGF-β (hESCs Pluri.). eIF2α and eIF4G are phosphorylated in pluripotent hESCs more than in early differentiating hESCs (hESCs Diff.). Error bars represent s.d. (*, p < 0.01 compared to hESCs Pluri. samples).
Fig 2
Fig 2. LIF and BMP4 enhance eIF2α phosphorylation.
(A) mESCs were cultured for 24 h either with LIF (mESCs +LIF) or without LIF (mESCs–LIF). Increasing amounts of cell lysate (indicated by triangles) were separated by SDS-PAGE and proteins visualized by western blot. PKR was uniformly present in both samples, with no difference in active PKR levels (P-PKR). CReP levels were low in mESCs cultured with LIF and upregulated in mESCs cultured without LIF. Nck1/2 levels were uniform. Actin is a loading control. (B) Three biological replicates were prepared as in (A) and quantitated. Data were then normalized to values from mESCs grown without LIF. CReP levels increased when LIF was withdrawn, whereas PKR and Nck1/2 levels were unchanged. Error bars represent s.d. (*, p < 0.01 compared to mESCs–LIF samples). (C) mESCs were cultured for 24 h with increasing concentrations of LIF (10 ng/mL is standard). Increasing amounts of cell lysate (indicated by triangles) were separated by SDS-PAGE and western blotted for CReP, Nck1/2 and Actin. LIF downregulates CReP, but not Nck1/2 or Actin. (D) Three biological replicates were prepared as in (C) and quantitated. Data were normalized to values from mESCs cultured without LIF. Increasing LIF decreases CReP levels, but does not affect Nck1/2. Error bars represent s.d. (*, p < 0.01 compared to 0 ng/mL LIF samples). (E) mESCs were cultured for 24 h with or without LIF and with or without BMP4 (indicated by + and–signs). Higher levels of active P-PKR were seen with BMP4, less with BMP4 removed. P-eIF2α levels were highest in mESCs grown with both LIF and BMP4. Total PKR and eIF2α levels were constant as was Actin, probed as a loading control. (F) The presence of active P-PKR was assayed by co-IP for PKR and its substrate eIF2α. mESCs were cultured as in (E); Western blots visualized PKR and eIF2α in total cell lysates (Input; upper panels) or PKR IPs (Anti-PKR IP; lower panels). eIF2α is present in all inputs (upper panel), but eIF2α co-IPs with PKR only in cells treated with BMP4 (lower panel).
Fig 3
Fig 3. eIF2α phosphorylation correlates with Nanog and c-Myc expression.
(A) mESCs were cultured for 24 h either with LIF (mESCs +LIF) or without LIF (mESCs–LIF). Increasing amounts of cell lysate (indicated by triangles) were separated by SDS-PAGE and western blotted for indicated proteins. Nanog and c-Myc protein levels decreased after LIF withdrawal, whereas Oct4 levels were more modestly decreased when LIF was withdrawn. Actin served as a loading control. (B) Three biological replicates were prepared as in (A) and quantitated. Data were then normalized to values from mESCs grown with LIF. Error bars represent s.d. (*, p < 0.01 compared to mESCs +LIF samples). (C) RNA was prepared from mouse ESCs cultured as in (A) and RT-qPCR used to assay abundance of indicated RNAs. Loading was normalized to a control probe set (eEF1A mRNA). To provide relative mRNA abundance, data were normalized to mESCs grown with LIF. Nanog, c-Myc and Oct4 mRNA levels were unaltered in mESCs grown with or without LIF. Error bars represent s.d. (D) Mouse ESCs were cultured with LIF and BMP4. Colonies were then fixed and stained for the indicated proteins (IF samples); DAPI staining was used to visualize nuclear DNA. Nanog, c-Myc and Oct4 proteins were detectable in all cells within a colony. Mouse ESC cell divisions were confirmed by counting and calculating the percentage of cells in M phase for each sample, as shown below each representative colony. Scale bars: 50 μm. Three separate mESC cultures were used to quantitate M phase cells (s.d. shown).
Fig 4
Fig 4. Salubrinal, a CReP inhibitor, prolongs Nanog and c-Myc expression.
(A) mESCs were cultured as in Fig 3 with addition of salubrinal at 0 nM, 10 nM and 100 nM to mESCs cultured without LIF. Increasing amounts of cell lysate (indicated by triangles) were separated by SDS-PAGE and western blotted for indicated proteins. Treatment with salubrinal (Salu) increased the abundance of P-eIF2α, but had no effect on total eIF2α; salubrinal treatment also increased Nanog and c-Myc protein levels, but not Oct4 or Actin. (B) Three biological replicates were prepared as in (A) and quantitated. Data were then normalized to values from mESCs grown with LIF. Error bars represent s.d. (*, p < 0.01). (C) RNA was prepared from mouse ESCs cultured as in (A) and RT-qPCR used to assay abundance of indicated RNAs. All data were normalized to a control probe set (eEF1A mRNA) and mESCs grown with LIF. Nanog, c-Myc and Oct4 mRNA levels were unaltered in mESCs grown in various combinations of LIF and salubrinal (Salu). Error bars represent s.d. (*, p < 0.01 compared to mESCs–LIF samples). (D) Mouse ESCs were cultured with LIF (+LIF), without LIF (–LIF) or without LIF but with salubrinal (–LIF, +Salu) over several days. Cell numbers were counted on each day of culture. Mouse ESCs grown with LIF continued to divide (aqua line), whereas mESCs cultured without LIF (–LIF) rapidly stop dividing (purple line). Mouse ESCs cultured without LIF, but with salubrinal (–LIF, +Salu) (orange line) divided normally for several days but then senesced with the appearance of cell corpses suggesting apoptosis. (E) Mouse ESCs were cultured with LIF or without LIF, but with 100 nM salubrinal, for 5 days. Increasing amounts of cell lysate (indicated by triangles) was separated by 4–12% gradient SDS-PAGE and western blotted for indicated proteins. Nanog, c-Myc and Oct4 were all present in mESCs cultured with LIF. In mESCs cultured without LIF, but with added salubrinal, Nanog and c-Myc proteins were expressed at similar levels as in mESCs cultured in LIF. Oct4 levels were higher in mESCs cultured with LIF compared to mESCs cultured without LIF but with salubrinal. Actin was probed as a loading control. Therefore, salubrinal is sufficient to maintain Nanog and c-Myc protein expression, but cannot preserve Oct4 expression.
Fig 5
Fig 5. LIF and BMP4 regulate eIF2α phosphorylation and translation initiation.
A model for how LIF and BMP4 regulate translation initiation. LIF and BMP4 bind receptors on the cell surface leading to decreased CReP and increased PKR activity respectively. LIF signals to phosphorylate eIF4G via an unknown pathway. CReP loss and PKR activation increase P-eIF2α levels.

Similar articles

Cited by

References

    1. Watanabe A, Yamada Y, Yamanaka S. Epigenetic regulation in pluripotent stem cells: a key to breaking the epigenetic barrier. Philos Trans R Soc Lond B Biol Sci. 2013;368(1609):20120292 10.1098/rstb.2012.0292 - DOI - PMC - PubMed
    1. Warmflash A, Arduini BL, Brivanlou AH. The molecular circuitry underlying pluripotency in embryonic stem cells. Wiley Interdiscip Rev Syst Biol Med. 2012;4(5):443–56. 10.1002/wsbm.1182 . - DOI - PMC - PubMed
    1. Viswanathan SR, Daley GQ, Gregory RI. Selective blockade of microRNA processing by Lin28. Science. 2008;320(5872):97–100. 10.1126/science.1154040 - DOI - PMC - PubMed
    1. Yu J, Vodyanik MA, Smuga-Otto K, Antosiewicz-Bourget J, Frane JL, Tian S, et al. Induced pluripotent stem cell lines derived from human somatic cells. Science. 2007;318(5858):1917–20. Epub 2007/11/22. 10.1126/science.1151526 . - DOI - PubMed
    1. Anokye-Danso F, Trivedi CM, Juhr D, Gupta M, Cui Z, Tian Y, et al. Highly efficient miRNA-mediated reprogramming of mouse and human somatic cells to pluripotency. Cell Stem Cell. 2011;8(4):376–88. 10.1016/j.stem.2011.03.001 - DOI - PMC - PubMed

Publication types

MeSH terms