. 2015 Sep 24;163(1):246-55.
doi: 10.1016/j.cell.2015.09.002.

A high-resolution imaging approach to investigate chromatin architecture in complex tissues

Affiliations

A high-resolution imaging approach to investigate chromatin architecture in complex tissues

Michael W Linhoff et al. Cell. .

Abstract

We present ChromATin, a quantitative high-resolution imaging approach for investigating chromatin organization in complex tissues. This method combines analysis of epigenetic modifications by immunostaining, localization of specific DNA sequences by FISH, and high-resolution segregation of nuclear compartments using array tomography (AT) imaging. We then apply this approach to examine how the genome is organized in the mammalian brain using female Rett syndrome mice, which are a mosaic of normal and Mecp2-null cells. Side-by-side comparisons within the same field reveal distinct heterochromatin territories in wild-type neurons that are altered in Mecp2-null nuclei. Mutant neurons exhibit increased chromatin compaction and a striking redistribution of the H4K20me3 histone modification into pericentromeric heterochromatin, a territory occupied normally by MeCP2. These events are not observed in every neuronal cell type, highlighting ChromATin as a powerful in situ method for examining cell-type-specific differences in chromatin architecture in complex tissues.


Figures

Figure 1
Figure 1. Quantitative Analysis of Chromatin Architecture In Hippocampal Pyramidal Neurons
(A) DAPI stained nuclei in a 200 nm hippocampal section from a symptomatic female RTT mouse (Mecp2-egfpB./+). The image was stitched from multiple fields acquired using a 25X objective. Scale bar, 100 μm. The white rectangle encloses the portion of the CA1 pyramidal cell layer used for high-resolution imaging. (B) Volume rendering of 59 serial sections (200 nm thick) through the hippocampal pyramidal cell layer. DAPI labels nuclei, and an antibody to GFP was used to identify cells expressing MeCP2-GFP. Note mosaic expression of Mecp2-egfp gene due to random Xi. Scale bar, 10 μm. (C-F) Nucleus from a WT pyramidal neuron. (C) Volume rendering of the nucleus viewed along the x-y axis. Scale bar, 1 μm. (D) Nucleus viewed along the y-z axis. (E) 3D surfaces (red) used to isolate heterochromatin for quantification. (F) A single 3D surface (blue) encloses the entire contents of the nucleus. (G-I) Analysis of WT and Mecp2-null pyramidal neurons. (G) Scatter plot showing the percentage of total nuclear DAPI pixel intensity located within the heterochromatin threshold (mean ± SD). (WT, 22.5 ± 2.5 %, n = 51 nuclei from 3 mice), (null, 27.1 ± 2.2 %, n = 55 nuclei from 3 mice). Unpaired t test, p < 0.0001. Xi chromosome values were subtracted from total heterochromatin. (H) Scatter plot showing the density of DAPI pixel intensity within the heterochromatin threshold (mean ± SD). Density is expressed as pixel intensity (×103) per μm3. (WT, 50.7 ± 2.8), (null, 54.4 ± 2.9). Unpaired t test, p < 0.0001. (I) Scatter plot showing heterochromatin volume (mean ± SD). (WT, 8.0 ± 1.0 μm3), (null, 9.0 ± 0.9 μm3). Unpaired t test, p < 0.0001. See also Figure S1 and Movie S1.
Figure 2
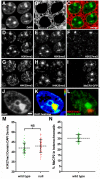
Figure 2. Multiplexed Immunostaining for Histone Modifications
Panels A-I represent fluorescence images acquired using the same 200 nm section through the hippocampal pyramidal cell layer. (A) DAPI staining of CA1 pyramidal neuron nuclei. Right, two WT nuclei (see panel I). Left, two mutant nuclei. Scale bar, 2 μm. (B) Binding of the lectin Concanavalin A (ConA) to membrane glycoproteins. (C) Merge of ConA (red) with DAPI (green). (D) Immunostaining for H3K9me2. (E) Immunostaining for H3K9me3. (F) Immunostaining for H3K27me3. The two intense H3K27me3 clusters represent the Xi. These clusters are not visible in the two lower nuclei because this image is of a single 200 nm section. (G) Immunostaining for H4K20me2. (H) Immunostaining for H4K20me3. (I) Immunostaining for the MeCP2-GFP fusion protein. (J) DAPI staining of a nucleus from a WT neuron. Panels J-L represent fluorescence images acquired from the same 200 nm section from another mouse. Scale bar, 1 μm. (K) Heatmap representation of DAPI pixel intensity for the section shown in Figure 2J. The two adjacent heterochromatin clusters exhibit different density profiles. Bar shows heatmap index. (L) Merged immunostaining for MeCP2-GFP (green) and H3K27me3 (red). MeCP2-GFP is enriched in the heterochromatin cluster with higher DAPI pixel intensity in Figure 2K, while H3K27me3 enriched heterochromatin has lower DAPI pixel intensity. (M) Scatter plot showing Xi DAPI pixel density (mean ± SD). Density is expressed as pixel intensity (×103) per μm3. (WT, 42.0 ± 2.5, n=51), (null, 43.0 ± 3.3, n=55). Unpaired t test, p = 0.078. (N) Scatter plot showing the percentage of MeCP2-GFP (mean ± SD) localized within the heterochromatin threshold in WT neurons. (30.4 ± 3.3 %, n=51). See also Movie S2.
Figure 3
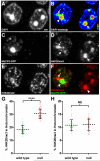
Figure 3. The H4K20me3 Modification is Redistributed Spatially Upon Loss of MeCP2
Panels A-F represent fluorescence images acquired using the same 200 nm section through the hippocampal pyramidal cell layer. (A) DAPI staining. Scale bar, 1 μm. (B) Relative pixel intensity of DAPI staining. Heat map index is located in the lower right corner. Arrow indicates lower intensity heterochromatin still within threshold value. Arrowhead points to high intensity heterochromatin. (C) Immunostaining for MeCP2-GFP. Left, WT nucleus; Right, Mecp2-null nucleus. (D) Immunostaining for H4K20me3. Arrows and arrowhead as in Fig. 3B. (E) Immunostaining for H4K20me2. (F) Merged image for MeCP2-GFP and H4K20me3. In the WT nucleus, MeCP2-GFP binding dominates in pericentromeric heterochromatin (arrowhead) while H4K20me3 localizes to the heterochromatin region with lower DAPI density (arrow). (G) Scatter plot showing percentage of total nuclear H4K20me3 within heterochromatin in pyramidal neurons (mean ± SD). There is a significant redistribution of H4K20me3 into heterochromatin after loss of MeCP2 (WT, 18.5 ± 3.0, n = 36 nuclei from 3 mice), (null, 30.5 ± 3.5, n = 41 nuclei from three mice). Unpaired t test, p < 0.0001. (H) Scatter plot showing the percentage of total nuclear H4K20me2 within heterochromatin (mean ± SD) for pyramidal neurons. (WT, 10.8 ± 2.1, n = 27 nuclei from 2 mice), (null, 11.0 ± 2.2, n = 31 nuclei from two mice). Unpaired t test, p = 0.72. See also Figure S2, Figure S3, and Movie S3.
Figure 4
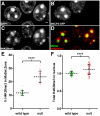
Figure 4. The H4K20me3 Modification Expands Into Pericentromeric Heterochromatin in Mecp2-Null Nuclei
Panels A-D represent fluorescence images taken from a volume rendering through the hippocampal pyramidal cell layer. (A) DAPI staining. Scale bar, 1 μm. (B) Immunostaining for MeCP2-GFP identifies left neuron as WT and right neuron as Mecp2-null. (C) Immunostaining for H4K20me3. (D) Merged image showing H4K20me3 distribution (red) relative to major satellite FISH signal (green). In the WT neuron, H4K20me3 enriched regions are peripheral to the major satellite heterochromatin territory. (E) Scatter plot showing the percentage of total nuclear H4K20me3 within the major satellite threshold (mean ± SD). There is a significant redistribution of H4K20me3 into pericentromeric heterochromatin after loss of MeCP2 (WT, 11.8 ± 1.8, n = 19 nuclei from 3 mice), (null, 23.7 ± 4.4, n = 19 nuclei from three mice). Unpaired t test, p < 0.0001. (F) The relative amount of H4K20me3 within the nucleus (mean ± SD) is compared between WT and null neurons. Intensity units represent total integrated intensity (×106) with mean intensity normalized for WT pyramidal neurons. (WT, 1.00 ± 0.01, n = 46 nuclei from 3 animals), (null, 1.11 ± 0.02, n = 50 nuclei from three mice). Unpaired t test, p < 0.0001. See also Movie S4.
Figure 5
Figure 5. H4K20me3 Redistribution in Mecp2-Null Nuclei is a Cell Type Specific Event
Panels A-D represent fluorescence images taken from a volume rendering through the suprapyramidal dentate granule cell layer. (A) DAPI staining. Scale bar, 1 μm. (B) Immunostaining for MeCP2-GFP identifies left neuron as WT and right neuron as Mecp2-null. (C) Immunostaining for H4K20me3. (D) Merged image showing H4K20me3 distribution (red) relative to major satellite FISH signal (green). (E) Scatter plot showing the percentage of total nuclear H4K20me3 within the major satellite threshold (mean ± SD). There is a significant redistribution of H4K20me3 into pericentromeric heterochromatin after loss of MeCP2 (WT, 14.0 ± 1.8, n = 15 nuclei from two mice), (null, 27.0 ± 2.1, n = 15 nuclei from two mice). Unpaired t test, p < 0.0001. (F) Scatter plot showing the percentage of total nuclear DAPI pixel intensity located within the heterochromatin threshold (mean ± SD). (WT, 24.7 ± 2.7), (null, 28.5 ± 1.8). Unpaired t test, p < 0.0001. Panels G-J represent fluorescence images taken from a volume rendering through the cerebellar granule cell layer. (G) DAPI staining. Scale bar, 1 μm. (H) Immunostaining for MeCP2-GFP distinguishes between WT and MeCP2-null granule cells. (I) Immunostaining for H4K20me3. (J) Merged image showing H4K20me3 distribution (red) relative to major satellite FISH signal (green). (K) Scatter plot showing the percentage of total nuclear H4K20me3 within the major satellite threshold (mean ± SD). (WT, 30.7 ± 2.1, n = 17 nuclei from two mice), (null, 31.2 ± 1.8, n = 17 nuclei from two mice). Unpaired t test, p = 0.4075. (L) Scatter plot showing the percentage of total nuclear DAPI pixel intensity located within the heterochromatin threshold (mean ± SD). (WT, 56.2 ± 2.5), (null, 56.9 ± 3.0). Unpaired t test, p = 0.4526. See also Figure S4, Figure S5, and Movie S5.
Figure 6
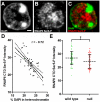
Figure 6. AT Analysis of Transcriptional Activity
Panels A-C represent fluorescence images acquired using the same 200 nm section through a pyramidal neuron. (A) DAPI staining. Scale bar, 1 μm. (B) Immunostaining with antibodies directed against the phosphorylated CTD (Ser5) of RNA polymerase II (RNAPII Ser5-P) to detect the active polymerase. (C) Merged image of DAPI and RNAPII Ser5-P. Note that RNAPII Ser5-P is excluded from heterochromatic foci. (D) Total integrated pixel intensity (×105) for RNAPII Ser5-P from WT nuclei was plotted versus heterochromatin content. RNAPII Ser5-P levels are negatively correlated with increasing heterochromatin content (n = 51 nuclei from 3 mice, Pearson r = − 0.72, p < 0.0001). (E) Scatter plot comparing RNAPII Ser5-P levels in WT and Mecp2-null pyramidal neurons. Intensity units represent total integrated pixel intensity (×105) with mean intensity normalized for WT pyramidal neurons. (WT, 27.0 ± 5.0, n = 51 nuclei from 3 animals), (null, 24.5 ± 5.2, n = 55 nuclei from three animals). Unpaired t test, p = 0.013.

Similar articles

Cited by

References

    1. Adler DA, Quaderi NA, Brown SD, Chapman VM, Moore J, Tate P, Disteche CM. The X-linked methylated DNA binding protein, Mecp2, is subject to X inactivation in the mouse. Mamm. Genome. 1995;6:491–492. - PubMed
    1. Amir RE, Van den Veyver IB, Wan M, Tran CQ, Francke U, Zoghbi HY. Rett syndrome is caused by mutations in X-linked MECP2, encoding methyl-CpG-binding protein 2. Nat. Genet. 1999;23:185–188. - PubMed
    1. Baker SA, Chen L, Wilkins AD, Yu P, Lichtarge O, Zoghbi HY. An AT-hook domain in MeCP2 determines the clinical course of Rett syndrome and related disorders. Cell. 2013;152:984–996. - PMC - PubMed
    1. Beliveau BJ, Boettiger AN, Avendaño MS, Jungmann R, McCole RB, Joyce EF, Kim-Kiselak C, Bantignies F, Fonseka CY, Erceg J, et al. Single-molecule super-resolution imaging of chromosomes and in situ haplotype visualization using Oligopaint FISH probes. Nat Commun. 2015;6:7147. - PMC - PubMed
    1. Belmont AS. Large-scale chromatin organization: the good, the surprising, and the still perplexing. Curr. Opin. Cell Biol. 2014;26:69–78. - PMC - PubMed

Publication types