. 2015 Sep 24;11(9):e1005153.
doi: 10.1371/journal.ppat.1005153. eCollection 2015 Sep.

Adipose Tissue Is a Neglected Viral Reservoir and an Inflammatory Site during Chronic HIV and SIV Infection

Affiliations

Adipose Tissue Is a Neglected Viral Reservoir and an Inflammatory Site during Chronic HIV and SIV Infection

Abderaouf Damouche et al. PLoS Pathog. .

Abstract

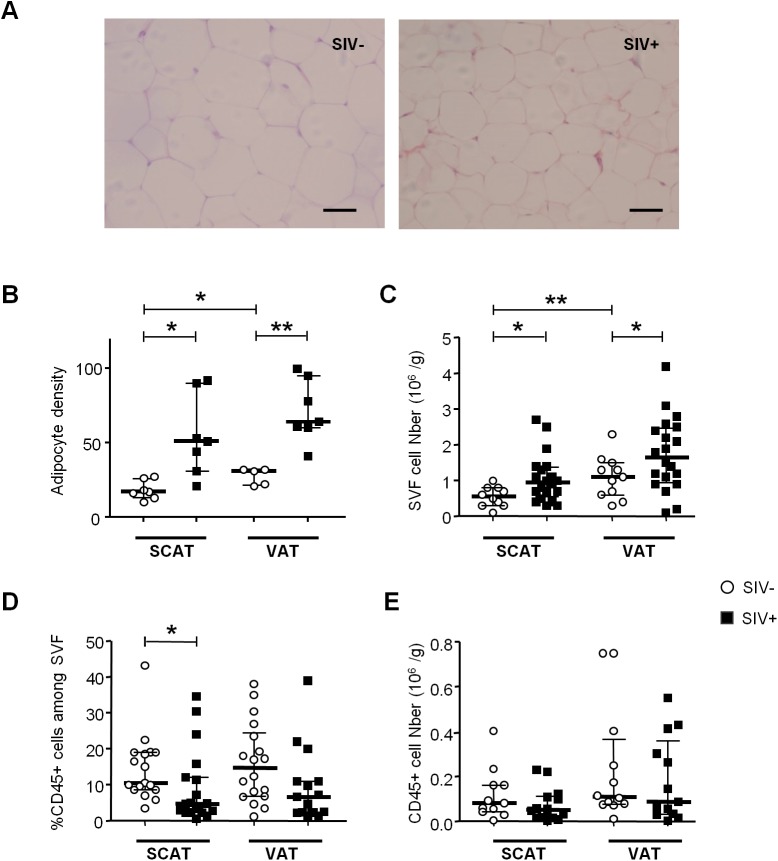
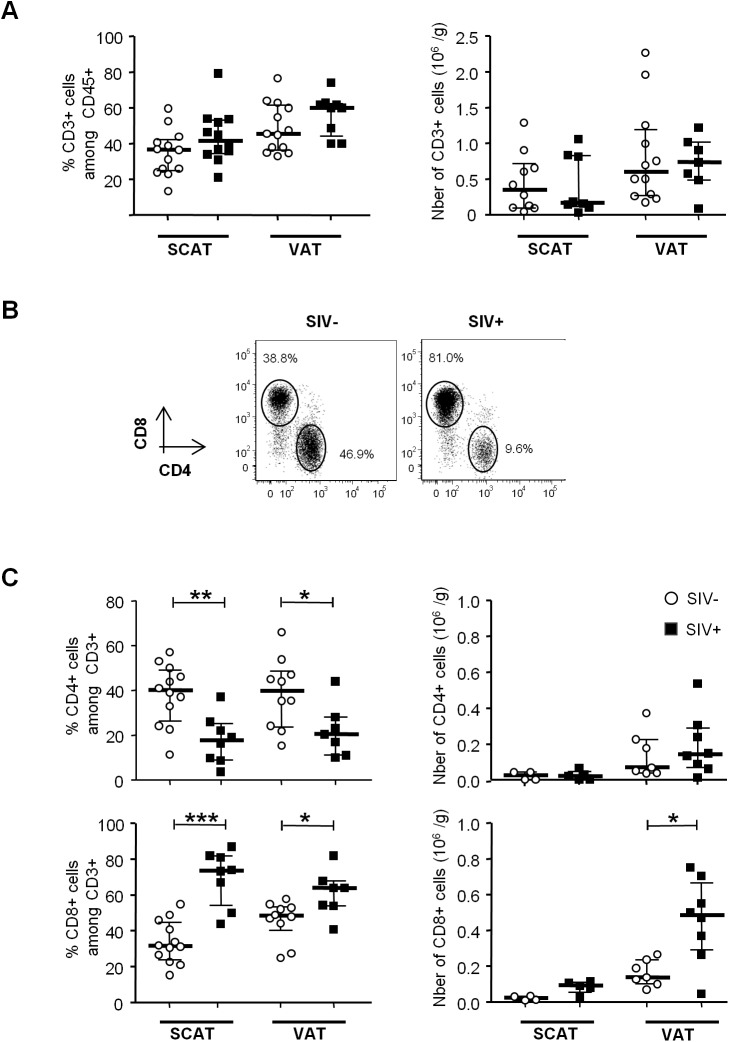
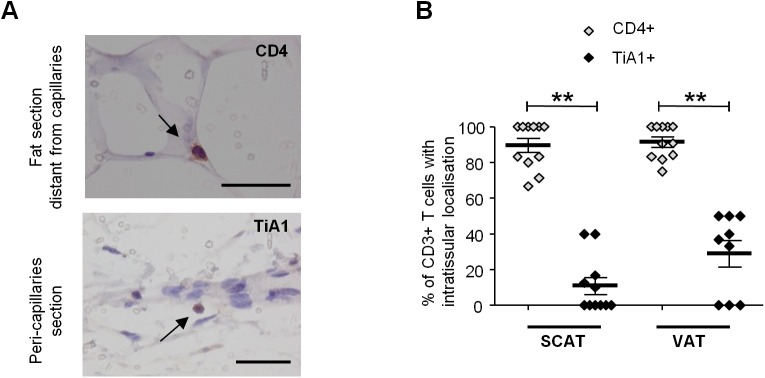
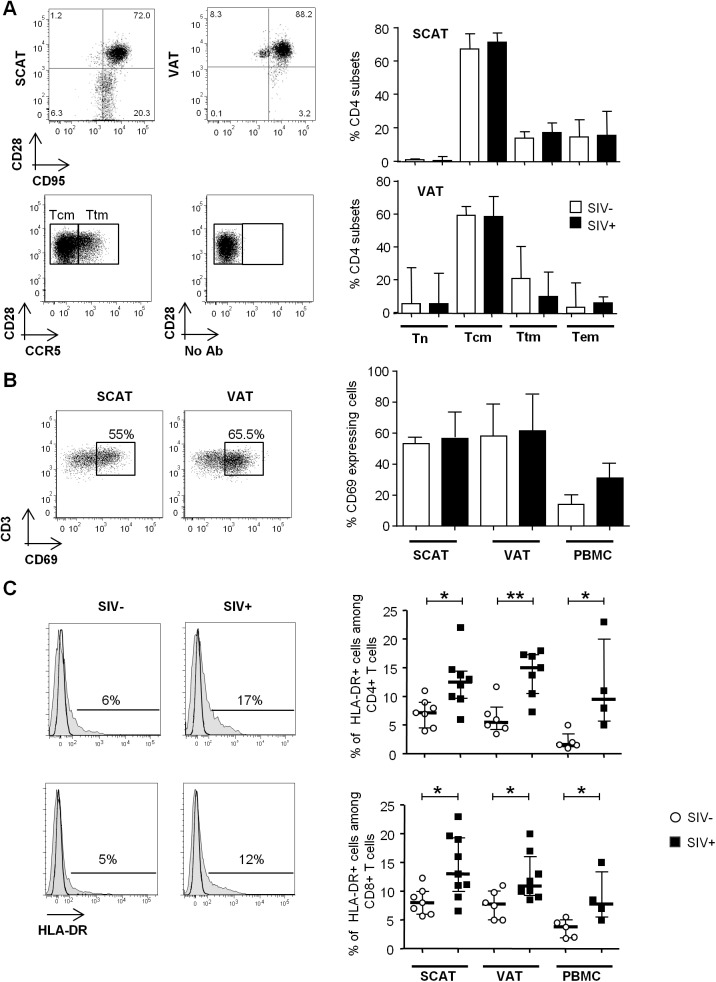
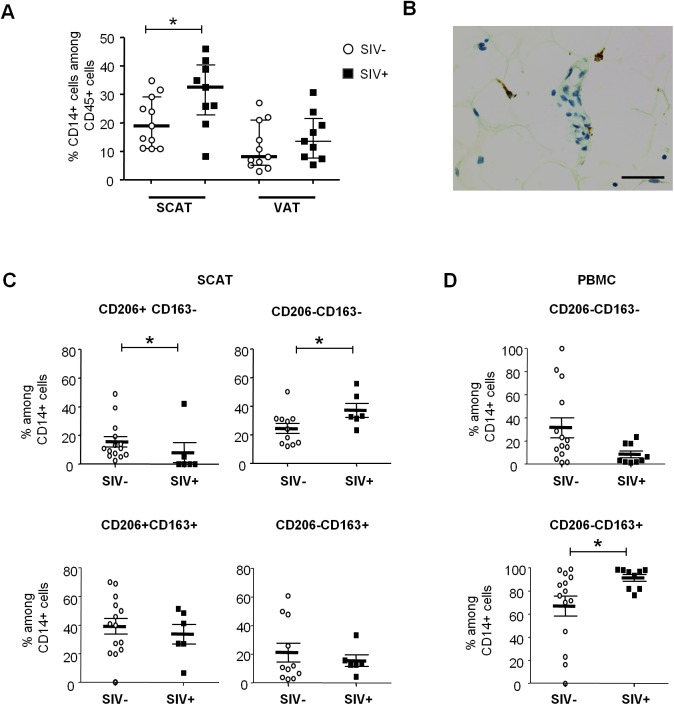
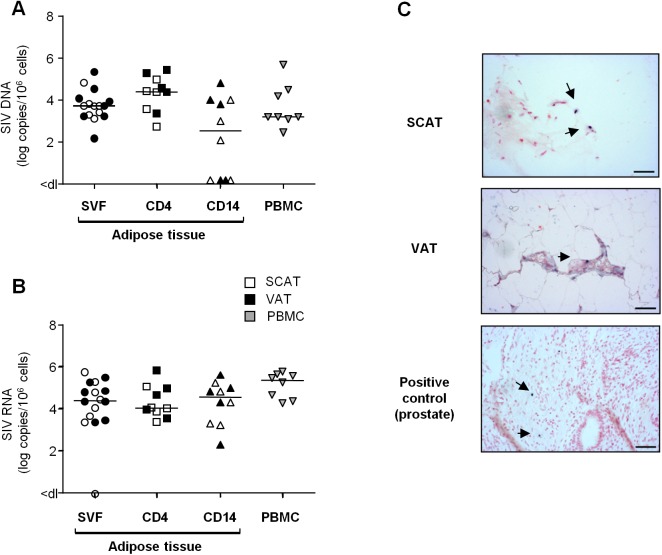
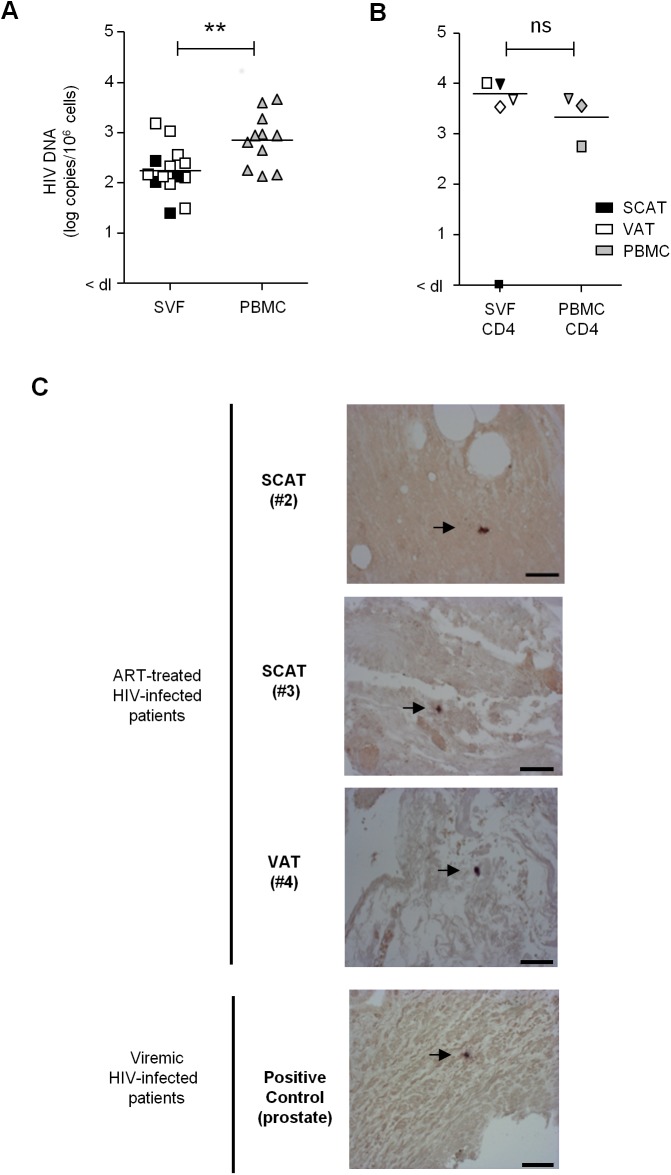
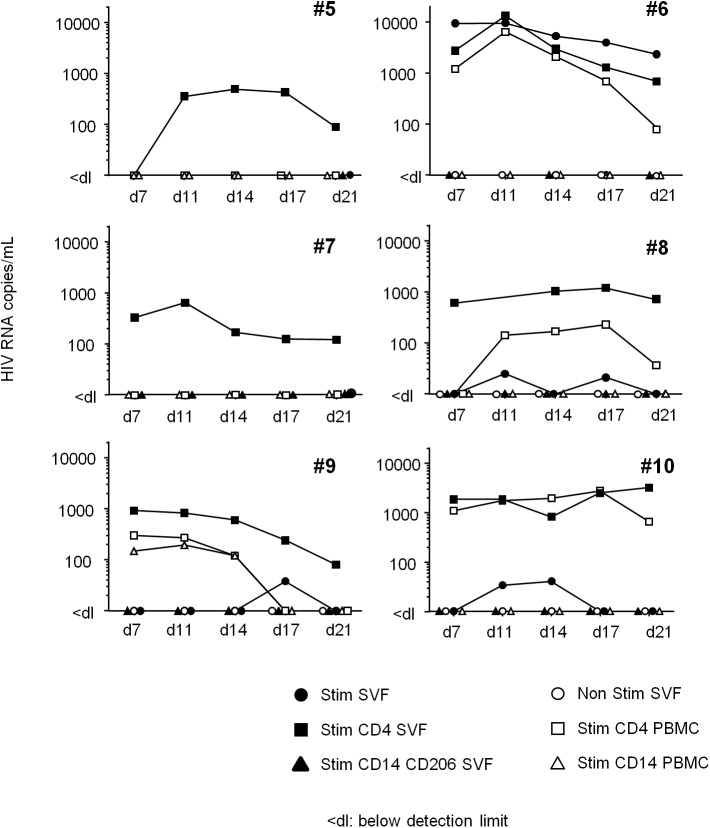
Two of the crucial aspects of human immunodeficiency virus (HIV) infection are (i) viral persistence in reservoirs (precluding viral eradication) and (ii) chronic inflammation (directly associated with all-cause morbidities in antiretroviral therapy (ART)-controlled HIV-infected patients). The objective of the present study was to assess the potential involvement of adipose tissue in these two aspects. Adipose tissue is composed of adipocytes and the stromal vascular fraction (SVF); the latter comprises immune cells such as CD4+ T cells and macrophages (both of which are important target cells for HIV). The inflammatory potential of adipose tissue has been extensively described in the context of obesity. During HIV infection, the inflammatory profile of adipose tissue has been revealed by the occurrence of lipodystrophies (primarily related to ART). Data on the impact of HIV on the SVF (especially in individuals not receiving ART) are scarce. We first analyzed the impact of simian immunodeficiency virus (SIV) infection on abdominal subcutaneous and visceral adipose tissues in SIVmac251 infected macaques and found that both adipocytes and adipose tissue immune cells were affected. The adipocyte density was elevated, and adipose tissue immune cells presented enhanced immune activation and/or inflammatory profiles. We detected cell-associated SIV DNA and RNA in the SVF and in sorted CD4+ T cells and macrophages from adipose tissue. We demonstrated that SVF cells (including CD4+ T cells) are infected in ART-controlled HIV-infected patients. Importantly, the production of HIV RNA was detected by in situ hybridization, and after the in vitro reactivation of sorted CD4+ T cells from adipose tissue. We thus identified adipose tissue as a crucial cofactor in both viral persistence and chronic immune activation/inflammation during HIV infection. These observations open up new therapeutic strategies for limiting the size of the viral reservoir and decreasing low-grade chronic inflammation via the modulation of adipose tissue-related pathways.


Conflict of interest statement

The authors have declared that no competing interests exist.

Figures

Fig 1
Fig 1. The influence of SIV infection on adipocyte and SVF cell density.
(A) Representative adipose tissue sections of SIV-infected and non-infected macaques. Scale bar: 50μm, magnification x 250. (B) The adipocyte density (numbers per HPF) in SCAT and VAT from 5 to 7 non-infected animals (SIV-) and 7 SIV-infected animals (SIV+). (C) Adipose tissue dissociation and counting of cells in the SVF was performed with 20 SIV+ animals and 10 SIV- animals. Counts are expressed per gram of adipose tissue. (D, E) Flow cytometry of the recovered SVF, yielding the proportion (D) and number (E) of CD45-expressing cells per gram of tissue. The analysis was performed for both SCAT and VAT; SIV- animals (n = 10) are represented by open circles and SIV+ animals (n = 12) are represented by filled squares. Data are quoted as the median [interquartile range]. Significant differences in a Mann-Whitney non-parametric test are shown as * p<0.05; ** p<0.01.
Fig 2
Fig 2. The influence of SIV infection on adipose-resident T cell subsets.
(A) Percentages and numbers (expressed per gram of adipose tissue recovered) of CD3-expressing cells among the CD45+ fraction from SCAT and VAT in non-infected animals (open circles) and SIV-infected animals (filled squares). Percentages were derived for 12 to 13 animals per group and counts were derived for 8 to 12 animals. (B) Representative dot plots showing CD4 and CD8 expression among CD3+ T cells in SIV-infected and non-infected animals. (C) Percentages and numbers (expressed per gram of adipose tissue) of CD4- and CD8-expressing cells among CD3+ cells recovered from SCAT and VAT of non-infected animals (open circles) and SIV-infected animals (filled squares). Percentages were derived for 8 to 12 animals per group and counts were derived for 5 to 8 animals. Data are quoted as the median [interquartile range]. Significant differences in a Mann-Whitney non-parametric test are shown as * p<0.05; ** p<0.01; *** p<0.001.
Fig 3
Fig 3. Localization of T cells in the adipose tissue of SIV-infected animals.
Immunochemical analyses were performed on 11 SCAT and 10 VAT of SIV-infected animals. (A) Representative tissue sections showing CD4+ T cells within fat and far from capillaries (upper) and TiA1+ cells in the vicinity of the capillaries (lower). Scale bar: 50 μm, magnification x640 for CD4, x500 for TiA1. (B) Percentages of CD4+ T cells (open diamonds) and CD8+ T cells (filled diamonds) far from capillaries, corresponding to adipose-resident lymphocyte subsets. Depending on the location, cells were counted after immunochemical staining on SCAT and VAT sections from SIV-infected animals. Data are quoted as the median [interquartile range]. Significant differences in a Mann-Whitney non-parametric test are shown as ** p<0.01.
Fig 4
Fig 4. The influence of SIV infection on T cell differentiation and activation status.
(A) The naïve and memory CD4+ T cell subset distribution in SCAT and VAT from SIV-infected or non-infected animals. Representative dot plots showing the gating strategies used to define Tn, Tcm, Ttm and Tem subsets among the CD4+ T cells, based on CD28, CD95 (upper dot plot, SCAT and VAT samples). CCR5 expression and the FMO profile in CD28+CD95+ fractions are shown (lower dot plot: VAT sample). The right-hand panels show the distribution of CD4+ T cells among the various subsets in non-infected animals (n = 5, open column) and SIV-infected animals (n = 7, filled column). (B) CD69 expression on CD4+ T cells recovered from SCAT, VAT and PBMCs from SIV-infected or non-infected animals. Representative dot plots for SCAT and VAT (left panel) and the percentages of CD69-expressing CD4+ T cells in SCAT, VAT and PBMCs from non-infected animals (n = 6, open columns) and SIV-infected animals (n = 7, filled columns) are shown. (C) HLA-DR expression on SCAT, VAT and PBMCs from SIV-infected or non-infected animals. Representative histograms showing HLA-DR expression on adipose-resident CD4+ and CD8+ T cells recovered from SCAT from non-infected (left panel) and SIV-infected animals (right-hand panel). HLA-DR expression histograms are shown in plain histogram. FMO staining (open histograms) was used to define the gating strategy. The percentage of HLA-DR-expressing cells among CD4+ and CD8+ T cells recovered from SCAT, VAT and PBMCs from non-infected animals (n = 6, open circles) and SIV-infected animals (n = 4–8, filled squares). Data are quoted as the median [interquartile range]. Significant differences in a Mann-Whitney non-parametric test are shown as * p<0.05; ** p<0.01.
Fig 5
Fig 5. The influence of SIV infection on adipose tissue macrophage numbers and phenotypes.
(A) The percentage of CD14-expressing cells among CD45+ cells recovered in the SVF from SCAT and VAT from non-infected animals (open circles, n = 13) and SIV-infected animals (filled squares, n = 9). (B) Representative adipose tissue sections, confirming the presence of macrophages in adipose tissue in immunochemical preparations (CD68 staining). Scale bar: 50 μm, magnification x400. (C, D) Analyses of CD206 and CD163 expression on adipose-resident CD14-expressing cells recovered from SCAT (C) and PBMCs (D) from non-infected animals (open circles, n = 11) and SIV-infected animals (filled squares, n = 9). CD206-expressing fractions were not detected in PBMCs. Gating strategies are shown in S4 Fig. Data are quoted as the median [interquartile range]. Significant differences in a Mann-Whitney non-parametric test are shown as * p<0.05.
Fig 6
Fig 6. Quantification of SIV DNA and RNA in adipose tissue cells.
(A, B) Quantification of SIV DNA (A) and RNA (B) was performed on SVF (n = 8), sorted adipose CD4+ T cells (CD4) or CD14-expressing cells (CD14) (n = 5) and PBMCs (n = 8) from SIV-infected animals. SIV DNA and RNA assays were performed in duplicate and the results are expressed in log SIV DNA copies per million cells. Data are quoted as the median [interquartile range]. Significant differences in a Mann-Whitney non-parametric test are shown as * p<0.05. (C) In situ hybridization for SIV RNA was performed on SCAT and VAT recovered from one macaque. Prostate tissue from a viremic SIV-infected macaque was used as positive control. One slide was analyzed for each sample. SIV RNA staining is shown at each site. Scale bar: 50 μm.
Fig 7
Fig 7. Detection of HIV DNA and RNA in adipose tissue.
(A) Detection of HIV DNA in SVF cells and PBMCs from 11 ART-treated, HIV-infected patients. Each patient is represented by a symbol, and the shading represents the type of adipose tissue: SCAT (open symbols), VAT (filled symbols). (B) HIV DNA detection in sorted CD4+ T cells recovered from adipose tissue and PBMCs from 3 ART-treated, HIV-infected patients. The HIV DNA detection assay was performed in duplicate and is expressed in log copies per million cells. The detection limit differed as a function of the numbers of cells tested and is indicated as <dl on the graph. (C) An in situ hybridization assay for HIV RNA was performed on three samples of adipose tissue recovered from ART-treated, HIV-infected patients (1 VAT and 2 SCAT samples). Positive control: a prostate tissue sample from a viremic patient. One slide was analyzed for each sample. HIV RNA staining for each positive patient is shown. Scale bar: 50 μm.
Fig 8
Fig 8. HIV RNA production following in vitro reactivation.
Total SVF (filled circles), sorted CD4+CD3+ (filled squares) and CD14+CD206+ cells (filled triangles) from adipose tissue, and sorted CD4+CD3+ (open squares) and CD14+ cells (open triangles) from PBMCs were co-cultured with allogeneic, pre-activated CD4+ T cells and then stimulated. The cell number differed according to the cell fraction: 1x10⁶ for the total SVF fraction, 1x10⁵ to 5x10⁵ for sorted CD4+ T cells, and 5x10⁴ to 2x10⁵ for sorted, CD14-expressing cells. HIV RNA was detected in supernatants collected at D7, 11, 14, 17 and 21. As a negative control, 1x10⁶ SVF cells were cultured in the absence of allogeneic, pre-activated CD4+ T cells (Ns SVF open circles). Samples from six ART-treated HIV infected patient were tested and the HIV RNA detection assay was performed five times for each sample.

Similar articles

Cited by

References

    1. Kuller LH, Tracy R, Belloso W, Wit S De, Drummond F, Lane HC, et al. Inflammatory and Coagulation Biomarkers and Mortality in Patients with HIV Infection. PLoS Med. 2008;5: 1496–1508. 10.1371/journal.pmed.0050203 - DOI - PMC - PubMed
    1. Deeks SG. HIV Infection, Inflammation, and Aging. Annu Rev Med. 2011;62: 141–055. 10.1146/annurev-med-042909-093756 - DOI - PMC - PubMed
    1. Deeks SG, Tracy R, Douek DC. Systemic effects of inflammation on health during chronic HIV infection. Immunity. 2013;39: 633–45. 10.1016/j.immuni.2013.10.001 - DOI - PMC - PubMed
    1. Hunt PW, Brenchley J, Sinclair E, Mccune JM, Roland M, Page-shafer K, et al. Relationship between T Cell Activation and CD4+ T Cell Count in HIV-Seropositive Individuals with Undetectable Plasma HIV RNA Levels in the Absence of Therapy. J Infect Dis. 2008;197: 126–133. 10.1086/524143 - DOI - PMC - PubMed
    1. Noel N, Boufassa F, Lécuroux C, Saez-Cirion A, Bourgeois C, Dunyach-Remy C, et al. Elevated IP10 levels are associated with immune activation and low CD4+ T-cell counts in HIV controller patients. AIDS. 2014;28: 467–76. 10.1097/QAD.0000000000000174 - DOI - PubMed

Publication types

MeSH terms

Grants and funding

This study was supported by the Agence Nationale de Recherche sur le Sida et les Hépatites Virales (ANRS, France). The funders had no role in study design, data collection and analysis, decision to publish, or preparation of the manuscript.