Plasma DNA tissue mapping by genome-wide methylation sequencing for noninvasive prenatal, cancer, and transplantation assessments
- PMID: 26392541
- PMCID: PMC4603482
- DOI: 10.1073/pnas.1508736112
Plasma DNA tissue mapping by genome-wide methylation sequencing for noninvasive prenatal, cancer, and transplantation assessments
Abstract
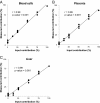
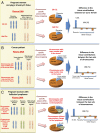
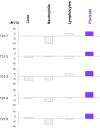
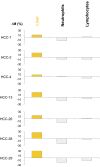
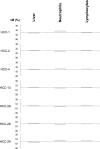
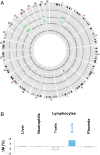
Plasma consists of DNA released from multiple tissues within the body. Using genome-wide bisulfite sequencing of plasma DNA and deconvolution of the sequencing data with reference to methylation profiles of different tissues, we developed a general approach for studying the major tissue contributors to the circulating DNA pool. We tested this method in pregnant women, patients with hepatocellular carcinoma, and subjects following bone marrow and liver transplantation. In most subjects, white blood cells were the predominant contributors to the circulating DNA pool. The placental contributions in the plasma of pregnant women correlated with the proportional contributions as revealed by fetal-specific genetic markers. The graft-derived contributions to the plasma in the transplant recipients correlated with those determined using donor-specific genetic markers. Patients with hepatocellular carcinoma showed elevated plasma DNA contributions from the liver, which correlated with measurements made using tumor-associated copy number aberrations. In hepatocellular carcinoma patients and in pregnant women exhibiting copy number aberrations in plasma, comparison of methylation deconvolution results using genomic regions with different copy number status pinpointed the tissue type responsible for the aberrations. In a pregnant woman diagnosed as having follicular lymphoma during pregnancy, methylation deconvolution indicated a grossly elevated contribution from B cells into the plasma DNA pool and localized B cells as the origin of the copy number aberrations observed in plasma. This method may serve as a powerful tool for assessing a wide range of physiological and pathological conditions based on the identification of perturbed proportional contributions of different tissues into plasma.
Keywords: circulating tumor DNA; epigenetics; liquid biopsy; noninvasive prenatal testing; transplantation monitoring.
Conflict of interest statement
The authors declare no conflict of interest.
Figures




Similar articles
-
Applications of genetic-epigenetic tissue mapping for plasma DNA in prenatal testing, transplantation and oncology.Elife. 2021 Mar 23;10:e64356. doi: 10.7554/eLife.64356. Elife. 2021. PMID: 33752803 Free PMC article.
-
Lengthening and shortening of plasma DNA in hepatocellular carcinoma patients.Proc Natl Acad Sci U S A. 2015 Mar 17;112(11):E1317-25. doi: 10.1073/pnas.1500076112. Epub 2015 Feb 2. Proc Natl Acad Sci U S A. 2015. PMID: 25646427 Free PMC article.
-
Preferred end coordinates and somatic variants as signatures of circulating tumor DNA associated with hepatocellular carcinoma.Proc Natl Acad Sci U S A. 2018 Nov 13;115(46):E10925-E10933. doi: 10.1073/pnas.1814616115. Epub 2018 Oct 29. Proc Natl Acad Sci U S A. 2018. PMID: 30373822 Free PMC article.
-
Liver-derived cell-free nucleic acids in plasma: Biology and applications in liquid biopsies.J Hepatol. 2019 Aug;71(2):409-421. doi: 10.1016/j.jhep.2019.04.003. Epub 2019 Apr 18. J Hepatol. 2019. PMID: 31004682 Review.
-
Plasma nucleic acid analysis by massively parallel sequencing: pathological insights and diagnostic implications.J Pathol. 2011 Nov;225(3):318-23. doi: 10.1002/path.2960. Epub 2011 Aug 24. J Pathol. 2011. PMID: 21984122 Review.
Cited by
-
Histone modifications of circulating nucleosomes are associated with changes in cell-free DNA fragmentation patterns.Proc Natl Acad Sci U S A. 2024 Oct 15;121(42):e2404058121. doi: 10.1073/pnas.2404058121. Epub 2024 Oct 9. Proc Natl Acad Sci U S A. 2024. PMID: 39382996 Free PMC article.
-
Application of graft-derived cell-free DNA for solid organ transplantation.Front Immunol. 2024 Sep 23;15:1461480. doi: 10.3389/fimmu.2024.1461480. eCollection 2024. Front Immunol. 2024. PMID: 39376561 Free PMC article. Review.
-
Analysis of the primary factors influencing donor derived cell-free DNA testing in kidney transplantation.Front Immunol. 2024 Sep 6;15:1435578. doi: 10.3389/fimmu.2024.1435578. eCollection 2024. Front Immunol. 2024. PMID: 39308855 Free PMC article. Review.
-
Biomarkers for diagnosis and therapeutic options in hepatocellular carcinoma.Mol Cancer. 2024 Sep 6;23(1):189. doi: 10.1186/s12943-024-02101-z. Mol Cancer. 2024. PMID: 39242496 Free PMC article. Review.
-
Prenatal cell-free DNA testing of women with pregnancy-associated cancer: a retrospective cross-sectional study.Lancet Reg Health Eur. 2024 Aug 7;45:101024. doi: 10.1016/j.lanepe.2024.101024. eCollection 2024 Oct. Lancet Reg Health Eur. 2024. PMID: 39220433 Free PMC article.
References
Publication types
MeSH terms
Substances
LinkOut - more resources
Full Text Sources
Other Literature Sources
Medical

