Genetic mapping uncovers cis-regulatory landscape of RNA editing
- PMID: 26373807
- PMCID: PMC4573499
- DOI: 10.1038/ncomms9194
Genetic mapping uncovers cis-regulatory landscape of RNA editing
Abstract
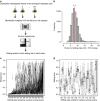
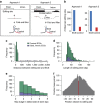
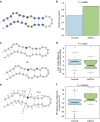
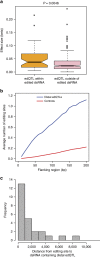
Adenosine-to-inosine (A-to-I) RNA editing, catalysed by ADAR enzymes conserved in metazoans, plays an important role in neurological functions. Although the fine-tuning mechanism provided by A-to-I RNA editing is important, the underlying rules governing ADAR substrate recognition are not well understood. We apply a quantitative trait loci (QTL) mapping approach to identify genetic variants associated with variability in RNA editing. With very accurate measurement of RNA editing levels at 789 sites in 131 Drosophila melanogaster strains, here we identify 545 editing QTLs (edQTLs) associated with differences in RNA editing. We demonstrate that many edQTLs can act through changes in the local secondary structure for edited dsRNAs. Furthermore, we find that edQTLs located outside of the edited dsRNA duplex are enriched in secondary structure, suggesting that distal dsRNA structure beyond the editing site duplex affects RNA editing efficiency. Our work will facilitate the understanding of the cis-regulatory code of RNA editing.
Figures


Similar articles
-
Genetic Determinants of RNA Editing Levels of ADAR Targets in Drosophila melanogaster.G3 (Bethesda). 2015 Dec 12;6(2):391-6. doi: 10.1534/g3.115.024471. G3 (Bethesda). 2015. PMID: 26656153 Free PMC article.
-
RNA editing underlies genetic risk of common inflammatory diseases.Nature. 2022 Aug;608(7923):569-577. doi: 10.1038/s41586-022-05052-x. Epub 2022 Aug 3. Nature. 2022. PMID: 35922514 Free PMC article.
-
Cis regulatory effects on A-to-I RNA editing in related Drosophila species.Cell Rep. 2015 May 5;11(5):697-703. doi: 10.1016/j.celrep.2015.04.005. Epub 2015 Apr 23. Cell Rep. 2015. PMID: 25921533 Free PMC article.
-
A-to-I RNA editing - thinking beyond the single nucleotide.RNA Biol. 2017 Dec 2;14(12):1690-1694. doi: 10.1080/15476286.2017.1364830. Epub 2017 Oct 11. RNA Biol. 2017. PMID: 28820319 Free PMC article. Review.
-
ADAR RNA editing below the backbone.RNA. 2017 Sep;23(9):1317-1328. doi: 10.1261/rna.060921.117. Epub 2017 May 30. RNA. 2017. PMID: 28559490 Free PMC article. Review.
Cited by
-
RNA editing alterations in a multi-ethnic Alzheimer disease cohort converge on immune and endocytic molecular pathways.Hum Mol Genet. 2019 Sep 15;28(18):3053-3061. doi: 10.1093/hmg/ddz110. Hum Mol Genet. 2019. PMID: 31162550 Free PMC article.
-
A-to-I RNA Editing in Klebsiella pneumoniae Regulates Quorum Sensing and Affects Cell Growth and Virulence.Adv Sci (Weinh). 2023 Jun;10(17):e2206056. doi: 10.1002/advs.202206056. Epub 2023 Apr 21. Adv Sci (Weinh). 2023. PMID: 37083223 Free PMC article.
-
Harnessing ADAR-Mediated Site-Specific RNA Editing in Immune-Related Disease: Prediction and Therapeutic Implications.Int J Mol Sci. 2023 Dec 26;25(1):351. doi: 10.3390/ijms25010351. Int J Mol Sci. 2023. PMID: 38203521 Free PMC article. Review.
-
RNA modification-related variants in genomic loci associated with body mass index.Hum Genomics. 2022 Jul 25;16(1):25. doi: 10.1186/s40246-022-00403-1. Hum Genomics. 2022. PMID: 35879730 Free PMC article.
-
Global analysis of A-to-I RNA editing reveals association with common disease variants.PeerJ. 2018 Mar 6;6:e4466. doi: 10.7717/peerj.4466. eCollection 2018. PeerJ. 2018. PMID: 29527417 Free PMC article.
References
-
- St Laurent G. et al.. Genome-wide analysis of A-to-I RNA editing by single-molecule sequencing in Drosophila. Nat. Struct. Mol. Biol. 20, 1333–1339 (2013). - PubMed
Publication types
MeSH terms
Substances
Associated data
- Actions
Grants and funding
LinkOut - more resources
Full Text Sources
Other Literature Sources
Molecular Biology Databases

