TNF Counterbalances the Emergence of M2 Tumor Macrophages
- PMID: 26365184
- PMCID: PMC4581986
- DOI: 10.1016/j.celrep.2015.08.033
TNF Counterbalances the Emergence of M2 Tumor Macrophages
Abstract
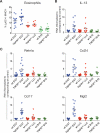
Cancer can involve non-resolving, persistent inflammation where varying numbers of tumor-associated macrophages (TAMs) infiltrate and adopt different activation states between anti-tumor M1 and pro-tumor M2 phenotypes. Here, we resolve a cascade causing differential macrophage phenotypes in the tumor microenvironment. Reduction in TNF mRNA production or loss of type I TNF receptor signaling resulted in a striking pattern of enhanced M2 mRNA expression. M2 gene expression was driven in part by IL-13 from eosinophils co-recruited with inflammatory monocytes, a pathway that was suppressed by TNF. Our data define regulatory nodes within the tumor microenvironment that balance M1 and M2 populations. Our results show macrophage polarization in cancer is dynamic and dependent on the balance between TNF and IL-13, thus providing a strategy for manipulating TAMs.
Copyright © 2015 The Authors. Published by Elsevier Inc. All rights reserved.
Figures

Similar articles
-
EGCG targeting STAT3 transcriptionally represses PLXNC1 to inhibit M2 polarization mediated by gastric cancer cell-derived exosomal miR-92b-5p.Phytomedicine. 2024 Dec;135:156137. doi: 10.1016/j.phymed.2024.156137. Epub 2024 Oct 19. Phytomedicine. 2024. PMID: 39566403
-
SPP1+ macrophages promote head and neck squamous cell carcinoma progression by secreting TNF-α and IL-1β.J Exp Clin Cancer Res. 2024 Dec 26;43(1):332. doi: 10.1186/s13046-024-03255-w. J Exp Clin Cancer Res. 2024. PMID: 39726047 Free PMC article.
-
PGRN is involved in macrophage M2 polarization regulation through TNFR2 in periodontitis.J Transl Med. 2024 Apr 30;22(1):407. doi: 10.1186/s12967-024-05214-7. J Transl Med. 2024. PMID: 38689292 Free PMC article.
-
Depressing time: Waiting, melancholia, and the psychoanalytic practice of care.In: Kirtsoglou E, Simpson B, editors. The Time of Anthropology: Studies of Contemporary Chronopolitics. Abingdon: Routledge; 2020. Chapter 5. In: Kirtsoglou E, Simpson B, editors. The Time of Anthropology: Studies of Contemporary Chronopolitics. Abingdon: Routledge; 2020. Chapter 5. PMID: 36137063 Free Books & Documents. Review.
-
Message Transmission Between Adipocyte and Macrophage in Obesity.Adv Exp Med Biol. 2024;1460:273-295. doi: 10.1007/978-3-031-63657-8_9. Adv Exp Med Biol. 2024. PMID: 39287855 Review.
Cited by
-
Identification of hub genes correlated with tumor-associated M1-like macrophage infiltration in soft tissue sarcomas.Front Genet. 2022 Dec 6;13:999966. doi: 10.3389/fgene.2022.999966. eCollection 2022. Front Genet. 2022. PMID: 36561315 Free PMC article.
-
TGFβ Signaling in Myeloid Cells Promotes Lung and Liver Metastasis Through Different Mechanisms.Front Oncol. 2021 Nov 18;11:765151. doi: 10.3389/fonc.2021.765151. eCollection 2021. Front Oncol. 2021. PMID: 34868988 Free PMC article.
-
Modeling of the immune response in the pathogenesis of solid tumors and its prognostic significance.Cell Oncol (Dordr). 2020 Aug;43(4):539-575. doi: 10.1007/s13402-020-00519-3. Epub 2020 Jun 2. Cell Oncol (Dordr). 2020. PMID: 32488850 Free PMC article. Review.
-
TCF4 enhances hepatic metastasis of colorectal cancer by regulating tumor-associated macrophage via CCL2/CCR2 signaling.Cell Death Dis. 2021 Sep 27;12(10):882. doi: 10.1038/s41419-021-04166-w. Cell Death Dis. 2021. PMID: 34580284 Free PMC article.
-
MicroRNA miR-29a Inhibits Colon Cancer Progression by Downregulating B7-H3 Expression: Potential Molecular Targets for Colon Cancer Therapy.Mol Biotechnol. 2021 Sep;63(9):849-861. doi: 10.1007/s12033-021-00348-1. Epub 2021 Jun 7. Mol Biotechnol. 2021. PMID: 34100183
References
-
- Alsina L, Israelsson E, Altman MC, Dang KK, Ghandil P, Israel L, von Bernuth H, Baldwin N, Qin H, Jin Z, et al. A narrow repertoire of transcriptional modules responsive to pyogenic bacteria is impaired in patients carrying loss-of-function mutations in MYD88 or IRAK4. Nat Immunol. 2014;15:1134–1142. - PMC - PubMed
-
- Bain CC, Scott CL, Uronen-Hansson H, Gudjonsson S, Jansson O, Grip O, Guilliams M, Malissen B, Agace WW, Mowat AM. Resident and pro-inflammatory macrophages in the colon represent alternative context-dependent fates of the same Ly6Chi monocyte precursors. Mucosal Immunol. 2013;6:498–510. - PMC - PubMed
Publication types
MeSH terms
Substances
Associated data
- Actions
- Actions
Grants and funding
LinkOut - more resources
Full Text Sources
Other Literature Sources
Molecular Biology Databases

