. 2015 Sep 22;112(38):E5327-35.
doi: 10.1073/pnas.1510795112. Epub 2015 Sep 8.

In-depth study of Mollivirus sibericum, a new 30,000-y-old giant virus infecting Acanthamoeba

Affiliations

In-depth study of Mollivirus sibericum, a new 30,000-y-old giant virus infecting Acanthamoeba

Matthieu Legendre et al. Proc Natl Acad Sci U S A. .

Abstract

Acanthamoeba species are infected by the largest known DNA viruses. These include icosahedral Mimiviruses, amphora-shaped Pandoraviruses, and Pithovirus sibericum, the latter one isolated from 30,000-y-old permafrost. Mollivirus sibericum, a fourth type of giant virus, was isolated from the same permafrost sample. Its approximately spherical virion (0.6-µm diameter) encloses a 651-kb GC-rich genome encoding 523 proteins of which 64% are ORFans; 16% have their closest homolog in Pandoraviruses and 10% in Acanthamoeba castellanii probably through horizontal gene transfer. The Mollivirus nucleocytoplasmic replication cycle was analyzed using a combination of "omic" approaches that revealed how the virus highjacks its host machinery to actively replicate. Surprisingly, the host's ribosomal proteins are packaged in the virion. Metagenomic analysis of the permafrost sample uncovered the presence of both viruses, yet in very low amount. The fact that two different viruses retain their infectivity in prehistorical permafrost layers should be of concern in a context of global warming. Giant viruses' diversity remains to be fully explored.

Keywords: Pleistocene; giant virus; permafrost.


Conflict of interest statement

The authors declare no conflict of interest.

Figures

Fig. 1.
Fig. 1.
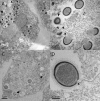
Imaging of Mollivirus particles. (A) Scanning electron microscopy of two isolated particles showing the apex structure. (B) Transmission electron microscopy (TEM) imaging of an ultrathin section of an open particle after fusion of its internal lipid membrane with that of a phagosome. (C) Enlarged view of the viral tegument of a Mollivirus particle highlighting the layer made of a mesh of fibrils (black arrow), resembling Pandoraviruses’ intermediate layer, and the underneath internal membrane (white arrow). Three ∼25-nm interspaced rings are visible around the mature particle. (D) Light microscopy (Nomarski optics 63×) imaging of a lawn of Mollivirus particles, some of them (black arrow) exhibiting a depression at the apex.
Fig. 2.
Fig. 2.
Ultrathin-section TEM imaging of Mollivirus-infected Acanthamoeba cells. (A) Appearance of the nucleus 5 h PI. The nucleolus has almost vanished, filled with fibrillary structures of unknown composition, and the nuclear membrane presents invaginations. The nucleus is surrounded by Mollivirus particles at various stages of maturation. (B) Details of a virus particle assembly. Arrowheads point to fibrillary structures. A black arrow points to a section tangent to the virion surface revealing the tegument organization. (C) Overall view of the cell at a late stage of infection. Black arrows point to deformed mature virions that are reproducibly seen in vacuoles. A mesh of fibers fills the VF. (D) Mollivirus particle at a late assembly stage. The particle is crowned with several fuzzy rings, and different tegument layers are visible. At least one lipid membrane is lining the internal face of the virion tegument. One of the numerous fibers filling the VF is reproducibly seen associated with the apex of the maturing particle.
Fig. 3.
Fig. 3.
Mollivirus EdU-labeled DNA visualized in infected Acanthamoeba castellanii. (A) Early transfer of the labeled viral DNA in the cell cytoplasm. (B) Viral DNA after migration next to the cell nucleus. (C) The labeled DNA seems to diffuse in the cell nucleus. Images were taken 30–90 min PI. The viral DNA is signaled by a black arrow, and the cell nucleus is identified by “N.” (Scale bar: 5 µm.)
Fig. S1.
Fig. S1.
Absence of large-scale repeated regions in the Mollivirus genome. (Left) A dot plot of the Mollivirus genomic sequence against itself was computed using the Gepard software (50) with default parameters. (Right) Dot plot of the concatenated peptide sequences of Mollivirus proteins with the word length parameter = 6. Most of the off-diagonal dots correspond to ankyrin motifs found in many different proteins.
Fig. S2.
Fig. S2.
Validation of the predicted protein-coding genes using RNA-seq. RNA-seq reads obtained at nine time points (30 min, 1–7, and 9 h PI) were mapped onto the Mollivirus genome using TopHat2 (51) with the following parameters: i = 20, I = 2,000, and b2-very-sensitive. The average coverage was computed as the average number of reads overlapping a given nucleotide position within each predicted gene or intergenic region.
Fig. 4.
Fig. 4.
Distribution of the best-matching homologs to Mollivirus and Pandoravirus salinus proteins. Best-matching homologous proteins were determined using BLASTP (E value < 10–5) against the nonredundant (NR) database at the National Center for Biotechnology Information (19).
Fig. S3.
Fig. S3.
Relative proportion of Mollivirus-, mitochondrion-, and Acanthamoeba-encoded proteins in the proteome of infected cells for all time points. Protein abundances [intensity-based absolute quantification (iBAQ) (52)] were normalized by the total abundance of all identified proteins at each time point. The peak (red distribution) seen at 30 min PI corresponds to the Mollivirus proteins brought about by the infecting particles and remaining in the phagocytic vacuoles.
Fig. 5.
Fig. 5.
Abundance of key DNA transcription and replication enzymes at various times PI. The variation in protein abundances [label-free quantification (LFQ)] (30) are plotted with solid lines for the Mollivirus proteins and in dashed lines for their cellular homologs. The quantification method used is described in SI Methods.
Fig. S4.
Fig. S4.
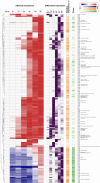
Relative abundances of Mollivirus-encoded proteins throughout the infectious cycle. The seven leftmost columns display the LFQ abundance of each reliably detected protein, relative to its value at 30 min PI (initial phagocytosis step) taken as a reference. Intensities are color-coded in red when abundance values are higher, and in blue when lower. The six middle columns display the purple-coded increment in abundance between two adjacent time points. The orange and green rightmost columns indicate the abundance of each protein 6 h PI and in the virion proteome, respectively.
Fig. 6.
Fig. 6.
Maximal variation in abundance of host proteins in Mollivirus-infected Acanthamoeba cells. Protein abundances (LFQ; SI Methods) were normalized by the total abundance of all identified A. castellanii proteins (including the mitochondrial ones) at each time point. These normalized abundances were used to construct an MA plot (31). The M axis corresponds to the binary logarithm of the ratio of the abundance measured 30 min PI and at the time point corresponding to the largest variation (relative to 30 min PI). The A axis corresponds to the average between those two values. Gray points correspond to proteins showing a maximal variation of less than twofold, whereas orange points have a maximal variation of more than twofold (Table S4). The abundance profiles (Top and Bottom Insets) throughout the entire infectious cycle are shown for the protein exhibiting the largest increment (ribonucleoside diphosphate reductase) and the largest decrease (a peroxidase) (red points).
Fig. 7.
Fig. 7.
Cumulative mapping of the metagenomic reads on the Mollivirus and Pithovirus genomes. Cumulative distribution of the 336 and 125 100-nt metagenomics reads that could be mapped (>92.5% identity) on the Mollivirus and Pithovirus genome sequence, respectively. Although only 4.8% of the Mollivirus genome and 2% of the Pithovirus genome are covered, the mapped read distributions are quite uniform, consistent with the presence of the whole viral genomes in the DNA mixture extracted from the permafrost sample. The vertical bars correspond to the multiple regularly interspersed copies of the noncoding repeat scattered along the Pithovirus genome (16). These repeats do not coincide with a local increase in genome coverage by metagenomics reads.
Fig. 8.
Fig. 8.
Cladistic clustering of representatives of the main families of large and giant DNA viruses infecting eukaryotes. The phylogenetic tree was constructed using neighbor joining on distances computed from a presence/absence matrix defined on 3,001 distinct genes clusters (SI Methods). Support values were estimated using bootstrap resampling (n = 10,000) and indicated when >50%.
Fig. S5.
Fig. S5.
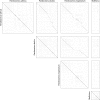
Concatenated proteins dot plots of Mollivirus sibericum against itself and the fully sequenced Pandoraviruses. Despite their large difference in size and detailed gene contents, the Pandoraviruses retain several large regions of colinearity. None is found in Mollivirus (right column).

Similar articles

Cited by

References

    1. La Scola B, et al. A giant virus in amoebae. Science. 2003;299(5615):2033. - PubMed
    1. Raoult D, et al. The 1.2-megabase genome sequence of Mimivirus. Science. 2004;306(5700):1344–1350. - PubMed
    1. Arslan D, Legendre M, Seltzer V, Abergel C, Claverie J-M. Distant Mimivirus relative with a larger genome highlights the fundamental features of Megaviridae. Proc Natl Acad Sci USA. 2011;108(42):17486–17491. - PMC - PubMed
    1. Claverie J-M, Abergel C. Mimivirus and its virophage. Annu Rev Genet. 2009;43:49–66. - PubMed
    1. Mutsafi Y, Zauberman N, Sabanay I, Minsky A. Vaccinia-like cytoplasmic replication of the giant Mimivirus. Proc Natl Acad Sci USA. 2010;107(13):5978–5982. - PMC - PubMed

Publication types

MeSH terms

LinkOut - more resources