. 2015 Sep 21;212(10):1571-87.
doi: 10.1084/jem.20150204. Epub 2015 Sep 7.

A novel IL-17 signaling pathway controlling keratinocyte proliferation and tumorigenesis via the TRAF4-ERK5 axis

Affiliations

A novel IL-17 signaling pathway controlling keratinocyte proliferation and tumorigenesis via the TRAF4-ERK5 axis

Ling Wu et al. J Exp Med. .

Abstract

Although IL-17 is emerging as an important cytokine in cancer promotion and progression, the underlining molecular mechanism remains unclear. Previous studies suggest that IL-17 (IL-17A) sustains a chronic inflammatory microenvironment that favors tumor formation. Here we report a novel IL-17-mediated cascade via the IL-17R-Act1-TRAF4-MEKK3-ERK5 positive circuit that directly stimulates keratinocyte proliferation and tumor formation. Although this axis dictates the expression of target genes Steap4 (a metalloreductase for cell metabolism and proliferation) and p63 (a transcription factor for epidermal stem cell proliferation), Steap4 is required for the IL-17-induced sustained expansion of p63(+) basal cells in the epidermis. P63 (a positive transcription factor for the Traf4 promoter) induces TRAF4 expression in keratinocytes. Thus, IL-17-induced Steap4-p63 expression forms a positive feedback loop through p63-mediated TRAF4 expression, driving IL-17-dependent sustained activation of the TRAF4-ERK5 axis for keratinocyte proliferation and tumor formation.


Figures

Figure 1.
Figure 1.
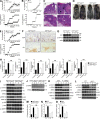
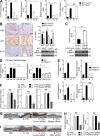
Keratinocyte-intrinsic IL-17 signaling is required for skin tumor formation. (A) Tumor numbers and tumor incidence of DMBA/TPA-treated IL-17RC WT and IL-17RC−/− mice (n = 8 mice per group). (B) Tumor numbers and tumor incidence of DMBA/TPA-treated Act1 WT and Act1−/− mice (n = 6 mice per group). (C) Histological analysis of DMBA/TPA-induced skin tumor in WT mice. (a) Full-thickness squamous dysplasia typical of SCC in situ. (b) Squamous dysplasia with increased mitotic figures (arrows), lack of maturation, and overlying parakeratosis, characteristic of SCC in situ. (c) Atypical squamous proliferation, with invasive islands into the dermis, indicative of invasive SCC. (d) Enlarged view of the indicated frame from c. (D) Photographs of K5CreAct1f/− and K5CreAct1f/+ mice treated with DMBA/TPA for 23 wk. (E) Tumor numbers and tumor incidence in DMBA/TPA-treated K5CreAct1f/− and K5CreAct1f/+ mice (n = 14 mice per group). (A, B, and E) Tumor numbers presented are the mean number of tumors per mouse ± SEM at different time points. *, P < 0.05; **, P < 0.01 (two-way ANOVA). (F) Immunohistochemistry staining for CD4 and Gr1+ cells in the TPA-treated skin of K5CreAct1f/− and K5CreAct1f/+ mice. Bars: (C, a and c) 300 µm; (C, b) 100 µm; (F) 50 µm. (G) Western blot analysis of epidermal lysates from TPA-treated K5CreAct1f/− and K5CreAct1f/+ mice. Each lane represents an individual sample. (H) Gene expression analysis from the skin of TPA-treated K5CreAct1f/− and K5CreAct1f/+ mice graphed as relative fold over untreated (mean and SEM were derived from biological replicates, n = 3). (I) Western blot analysis of the tumor tissue from DMBA/TPA-treated K5CreAct1f/− and K5CreAct1f/+ mice. (J) Immunoprecipitation of ERK5 with anti-ERK5, followed by Western blot analysis with anti-pERK5 using lysates of individual tumors from K5CreAct1f/− and K5CreAct1f/+ mice treated with DMBA/TPA. (K and L) Western blot analysis of the tumor tissue from DMBA/TPA-treated IL-17RC WT and IL-17RC−/− mice (K) and Act1 WT and Act1−/− mice (L). Each lane represents an independent sample. (M–O) Il6 expression analysis from nontumor (N) or tumor (T) samples of K5CreAct1f/− and K5CreAct1f/+ mice (M), IL-17RC WT and IL-17RC−/− mice (N), and Act1 WT and Act1−/− mice (O) harvested at the end of DMBA/TPA treatment. Gene expression is graphed as mean fold induction of tumor over nontumor ± SEM. SEM was derived from biological replicates (n = 3 samples from independent mice). Data are representative of at least three experiments. *, P < 0.05; **, P < 0.01.
Figure 2.
Figure 2.
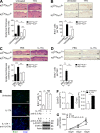
IL-17 stimulation induces keratinocyte proliferation. (A) H&E staining of TPA-treated K5CreAct1f/− and K5CreAct1f/+ mice. (B) BrdU staining in mice treated as in A, with BrdU (100 µg per mouse) injected 24 h before tissue collection. (C) Ears of K5CreAct1f/− and K5CreAct1f/+ mice were injected intradermally either with IL-17A in PBS or PBS alone. H&E staining of PBS or IL-17A–injected ear sections of K5CreAct1f/− and K5Cre+Act1f/+ mice. (A and C) Graphs represent mean epidermal thickness in arbitrary units ± SEM. (D) BrdU staining of PBS or IL-17A–injected ear section of K5CreAct1f/− and K5CreAct1f/+ mice. (B and D) Graphs represent mean BrdU+ cells per 10× magnification field ± SEM. (E) Serum-starved primary keratinocytes left untreated or treated with IL-17A or IL-17A + 2 µg/ml anti–IL-6 neutralizing antibody for 24 h, with BrdU added during the last 2 h. Graph represents mean percentage of BrdU+ cells per 10× magnification field ± SEM. Western blot with the indicated antibodies using lysates from keratinocytes untreated or treated with IL-6 (50 ng/ml, 30 min) with or without the presence of 2 µg/ml IL-6 neutralizing antibody. Bars: (A–D) 50 µm; (E) 100 µm. (F) Gene expression of Cyclin D and c-myc in primary keratinocytes left untreated or treated with IL-17A ± SEM. (G) Primary keratinocytes left untreated or treated with IL-17A or IL-17A + 2 µg/ml anti–IL-6 neutralizing antibody for the indicated days, followed by counting of cells total cell numbers. Three replicates for each time point ± SEM are shown. For imaging analysis, five fields were analyzed. All the data are representative of at least three experiments. *, P < 0.05; **, P < 0.01; ***, P < 0.001.
Figure 3.
Figure 3.
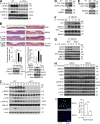
The MEKK3–ERK5 axis is critical for IL-17–induced epidermal keratinocyte proliferation. (A) Western blot analysis of epidermal lysates from ears of WT and IL-17RC−/− mice injected with IL-17A for the indicated times. (B) H&E staining of ear sections of C57BL/6 WT mice injected with PBS, IL-17A in the presence or absence of ERK5 siRNA (left), or MEK5 inhibitor Bix 02189 (right). Graphs represent mean epidermal thickness (a.u.) ± SEM. ***, P < 0.001 (Student’s t test, five fields were analyzed; n = 5 mice per group). Western blots were performed to show ERK5 siRNA efficacy and MEK5 inhibitor specificity in vivo. Epidermal lysates from C57BL/6 WT mice 48 h after injection with control siRNA and ERK5 siRNA were subjected to Western blotting with antibodies against ERK5, ERK1/2, and actin to show the ERK5 knockdown efficiency. Each lane represents one independent sample. Likewise, epidermal lysates from WT C57/B6 WT mice 8 h after injection with PBS, IL-17A, and IL-17A + Bix 02189 were subjected to Western blotting with antibodies to show MEK5 inhibitor specificity in vivo. (C) Western blot analysis of primary keratinocytes isolated from Act1 WT or Act1−/− mice and stimulated with 100 ng/ml IL-17A for the indicated times. Data are representative of three independent experiments. (D and E) HeLa cells were transiently cotransfected with Flag-tagged mouse Act1 and Myc-tagged MEKK3. Lysates of transfected cells were subjected to immunoprecipitation with anti-Myc (D) or anti-Flag (M2; E) antibodies, followed by Western blot analysis. (F) HeLa cells were treated with IL-17A, and lysates were immunoprecipitated with anti-MEKK3, followed by Western blot analysis. (G) Act1 WT and Act1−/− kidney epithelial cells were treated with IL-17A for the indicated times. Lysates were immunoprecipitated with anti-MEKK3 antibody, followed by Western blot analysis. (H) Primary keratinocytes were isolated from MEKK3f/f mice, followed by infection with adenovirus encoding Cre-recombinase or empty vector. Cells were then stimulated with IL-17A, followed by Western blot analysis. (I) BrdU incorporation of serum-starved MEKK3-deficient keratinocytes (as described in H) treated with IL-17A for 24 h, with 10 µM BrdU added during the last 2 h. Graph represents mean percentage of BrdU+ cells per field (n = 5 fields) ± SEM. ***, P < 0.001 (Student’s t test). Bars: (B) 50 µm; (I) 100 µm. All the data are representative of at least three experiments.
Figure 4.
Figure 4.
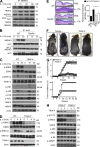
TRAF4 is a bridge protein for the Act1-mediated MEKK3–ERK5 pathway. (A) WT kidney epithelial cells were treated with IL-17A for the indicated times. Lysates were then immunopreciptated with anti-MEKK3 antibody, followed by Western blot analysis. (B) TRAF4 WT and TRAF4−/− kidney epithelial cells were treated with IL-17A for the indicated times. Cell lysates were then immunopreciptated with anti-Act1 antibody, followed by Western blot analysis. (C) TRAF4 WT and TRAF4−/− primary keratinocytes were treated with IL-17A, followed by Western blot analysis. (D) Western blot analysis of epidermal lysates from ears of WT and TRAF4−/− mice injected with IL-17A for the indicated times. (E) H&E staining of ear sections from TRAF4 WT or TRAF4−/− mice injected intradermally with IL-17A or PBS alone. Graph represents mean epidermal thickness (arbitrary units) ± SEM. *, P < 0.05 (five fields were analyzed, Student’s t test). Bars, 50 µm. (F) Photographs of TRAF4+/− and TRAF4 −/− mice treated with DMBA/TPA for 22 wk. (G) Tumor numbers and tumor incidence of DMBA/TPA-treated TRAF4+/− and TRAF4−/− mice (n = 7 mice per group). Tumor numbers presented are the mean number of tumors per mice ± SEM at different time points. *, P < 0.05 (two-way ANOVA). (H) Western blot analysis of the tumor tissue from TRAF4+/− and TRAF4−/− mice. Each lane represents an independent sample. All experimental data were verified in at least three independent experiments.
Figure 5.
Figure 5.
The Act1–ERK5 axis mediates critical IL-17 target genes for keratinocyte proliferation. (A) Primary keratinocytes isolated from IL-17RC+/− or IL-17RC−/− mice were stimulated with IL-17A for the indicated times, followed by RT-PCR analysis. (B) Primary keratinocytes isolated from Act1 WT or Act1−/− mice were stimulated with IL-17A for the indicated times, followed by RT-PCR analysis. (C) Primary keratinocytes isolated from ERK5+/+ and ERK5f/f mice were infected with Cre-encoding adenovirus for 48 h before stimulation. Cells were then stimulated with IL-17A for the indicated times, followed by RT-PCR analysis. (D) Primary keratinocytes isolated from TRAF4 WT or TRAF4−/− mice were stimulated with IL-17A for the indicated times, followed by RT-PCR analysis. (E) Primary keratinocytes isolated from MEKK3f/f mice were infected with either Cre-encoding (AdCre) or empty adenovirus (AdGFP) for 48 h before stimulation. Cells were then stimulated with IL-17A for the indicated times, followed by RT-PCR analysis. (A–E) Gene expression is graphed as mean fold induction over untreated ± SEM. SEM was derived from three technical replicates. Data are representative of at least two independent experiments. (F and G) RNA isolated from the ear tissue of mice (with the same treatments as described in Fig. 3 B) was subjected to RT-PCR analysis. Gene expression is graphed as mean fold induction over PBS ± SEM. (H) RT-PCR analysis of the indicated genes isolated from the ear tissue of TRAF4 WT or TRAF4−/− mice injected with PBS or IL-17A. Gene expression is graphed as mean fold induction over PBS treated ± SEM. (F–H) SEM was derived from biological replicates (n = 5 mice). (I) H&E staining of ear skin sections from WT mice injected with PBS, IL-17A, IL-17A + control siRNA, or IL-17A + Steap4 siRNA (n = 5 mice each group). Bars, 50 µm. Graphs represent mean epidermal thickness (a.u.) ± SEM and were derived from five fields. Steap4 siRNA1 and Steap4 siRNA2 were used in experiments 1 and 2, respectively. Graph on the right shows RT-PCR analysis of Steap4 mRNA levels in the ear epidermis after IL-17A coinjection with control and Steap4 siRNA. (J) RNA isolated from the ear tissue of mice treated as in H using Steap4 siRNA1 was subjected to RT-PCR analysis. Gene expression is graphed as mean fold induction over PBS treated ± SEM. SEM was derived from biological replicates (n = 5 mice). (K) Western blot analysis of homogenized epidermal samples described in I. Student’s t test was used for all statistical analysis: *, P < 0.05; **, P < 0.01; ***, P < 0.001. All the data are representative of different independent experiments as described above.
Figure 6.
Figure 6.
IL-17A drives Steap4-mediated positive feedback on TRAF4 expression via expansion of ΔNp63+ basal cells. (A) RT-PCR analysis from nontumor (N) or tumor (T) samples of K5CreAct1f/− and K5CreAct1f/+ mice at 23 wk of DMBA/TPA treatment. Gene expression is graphed as mean fold of tumor over nontumor ± SEM. Data shown are representative of three independent experiments. (B) Immunohistochemistry staining of tumor tissue from K5CreAct1f/− or K5CreAct1f/+ mice for Ki67, p63, and Krt10. Graph represents mean percentage of Ki67, p63, and Krt10+ cells per field (n = 5) ± SEM. Western blot shows representative ΔNp63 expression levels in tumor tissues from DMBA/TPA-treated K5CreAct1f/− or K5CreAct1f/+ mice. Data are representative of three experiments. (C) Human A431 keratinocytes were transfected with ΔNp63 or empty vector. 36 h after transfection, levels of TRAF4 transcripts and ΔNp63 protein were analyzed by RT-PCR and Western blot. Traf4 expression is graphed as relative mean fold induction ± SEM. SEM was derived from three technical replicates. (D) Primary keratinocytes isolated from TRAF4 WT or TRAF4−/− mice were stimulated with IL-17A for the indicated times, followed by RT-PCR analysis for TRAF4 and ΔNp63. Gene expression is graphed as mean fold induction over untreated ± SEM. (E) RT-PCR analysis of the indicated genes from nontumor or tumor samples of TRAF4+/− and TRAF4−/− mice at 22 wk of DMBA/TPA treatment. Gene expression is graphed as mean fold induction of tumor over nontumor ± SEM. (D and E) SEM was derived from three technical replicates. Data are representative of at least two independent experiments. (F and H) RT-PCR analysis of Traf4, Steap4, and ΔNp63 levels in ear tissue of mice who underwent treatment with PBS, IL-17A, and IL-17A + control siRNA, Steap4 siRNA, or IL-17A ERK5 siRNA. Gene expression is graphed as mean fold induction of over PBS treatment ± SEM. SEM was derived from three technical replicates. (G and I) Immunohistochemistry staining of p63 on ear skin sections from WT mice intradermally injected with PBS, IL-17A, and IL-17A + control siRNA, Steap4 siRNA1, or ERK5 siRNA as described in Figs. 5 I and 3 B. (B, G, and I) Bars, 50 µm. Data are representative of at least three independent experiments. Student’s t test was used for all statistical analysis: *, P < 0.05; **, P < 0.01; ***, P < 0.001.
Figure 7.
Figure 7.
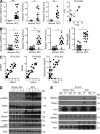
The TRAF4–ERK5 is a dominant pathway in human skin SCC. (A) RT-PCR analysis from FFPE sections of human normal or skin SCC samples. Gene expression is graphed as relative fold in SCC over normal skin. Each dot represents an independent sample. The last panel of A represents the linear regression of Il17a and Traf4. (B) Densitometric quantification of the indicated proteins in lysates of human normal skin (n = 15) or SCC (n = 17) as analyzed by Western blot. (A and B) Error bars represent SEM. SEM was derived from biological replicates. *, P < 0.05; **, P < 0.01 (Student’s t test). (C) Linear regression of the indicated protein levels in human normal skin or SCC as detected by Western blot. (D) Representative results of Western blot analysis of normal human skin or SCC. Each lane represents samples from an individual patient. (E) Freshly collected normal human skin or SCC samples were lysed and subjected to immunoprecipitation with anti-Act1 antibody, followed by Western blot analysis. Each pair of lanes (IgG, IP) represents a sample from an individual patient. All the data are representative of three experiments.

Similar articles

Cited by

References

    1. Bulek K., Liu C., Swaidani S., Wang L., Page R.C., Gulen M.F., Herjan T., Abbadi A., Qian W., Sun D., et al. . 2011. The inducible kinase IKKi is required for IL-17-dependent signaling associated with neutrophilia and pulmonary inflammation. Nat. Immunol. 12:844–852. 10.1038/ni.2080 - DOI - PMC - PubMed
    1. Camilleri-Broët S., Cremer I., Marmey B., Comperat E., Viguié F., Audouin J., Rio M.C., Fridman W.H., Sautès-Fridman C., and Régnier C.H.. 2007. TRAF4 overexpression is a common characteristic of human carcinomas. Oncogene. 26:142–147. 10.1038/sj.onc.1209762 - DOI - PubMed
    1. Castro N.E., and Lange C.A.. 2010. Breast tumor kinase and extracellular signal-regulated kinase 5 mediate Met receptor signaling to cell migration in breast cancer cells. Breast Cancer Res. 12:R60 10.1186/bcr2622 - DOI - PMC - PubMed
    1. Chae W.J., Gibson T.F., Zelterman D., Hao L., Henegariu O., and Bothwell A.L.. 2010. Ablation of IL-17A abrogates progression of spontaneous intestinal tumorigenesis. Proc. Natl. Acad. Sci. USA. 107:5540–5544. 10.1073/pnas.0912675107 - DOI - PMC - PubMed
    1. Chan K.S., Sano S., Kiguchi K., Anders J., Komazawa N., Takeda J., and DiGiovanni J.. 2004. Disruption of Stat3 reveals a critical role in both the initiation and the promotion stages of epithelial carcinogenesis. J. Clin. Invest. 114:720–728. 10.1172/JCI200421032 - DOI - PMC - PubMed

Publication types

MeSH terms