. 2015 Sep 15;112(37):E5160-8.
doi: 10.1073/pnas.1508836112. Epub 2015 Aug 31.

Receptor sequestration in response to β-arrestin-2 phosphorylation by ERK1/2 governs steady-state levels of GPCR cell-surface expression

Affiliations

Receptor sequestration in response to β-arrestin-2 phosphorylation by ERK1/2 governs steady-state levels of GPCR cell-surface expression

Justine S Paradis et al. Proc Natl Acad Sci U S A. .

Abstract

MAPKs are activated in response to G protein-coupled receptor (GPCR) stimulation and play essential roles in regulating cellular processes downstream of these receptors. However, very little is known about the reciprocal effect of MAPK activation on GPCRs. To investigate possible crosstalk between the MAPK and GPCRs, we assessed the effect of ERK1/2 on the activity of several GPCR family members. We found that ERK1/2 activation leads to a reduction in the steady-state cell-surface expression of many GPCRs because of their intracellular sequestration. This subcellular redistribution resulted in a global dampening of cell responsiveness, as illustrated by reduced ligand-mediated G-protein activation and second-messenger generation as well as blunted GPCR kinases and β-arrestin recruitment. This ERK1/2-mediated regulatory process was observed for GPCRs that can interact with β-arrestins, such as type-2 vasopressin, type-1 angiotensin, and CXC type-4 chemokine receptors, but not for the prostaglandin F receptor that cannot interact with β-arrestin, implicating this scaffolding protein in the receptor's subcellular redistribution. Complementation experiments in mouse embryonic fibroblasts lacking β-arrestins combined with in vitro kinase assays revealed that β-arrestin-2 phosphorylation on Ser14 and Thr276 is essential for the ERK1/2-promoted GPCR sequestration. This previously unidentified regulatory mechanism was observed after constitutive activation as well as after receptor tyrosine kinase- or GPCR-mediated activation of ERK1/2, suggesting that it is a central node in the tonic regulation of cell responsiveness to GPCR stimulation, acting both as an effector and a negative regulator.

Keywords: G protein-coupled receptor; MAPK; cell signaling; internalization; β-arrestin.


Conflict of interest statement

The authors declare no conflict of interest.

Figures

Fig. 1.
Fig. 1.
ERK/MAPK pathway activation reduces Gi activation and second-messenger production as well as GRK2 and βarr2 translocation in response to CXCR4 activation. (A) Schematic representation of the BRET-based ligand-induced Gi activation assay. (B and C) CXCL12-promoted Gi activation measured by BRET in HEK293T cells cotransfected with HA-CXCR4, Gαi1-RLucII, Gβ1, and Gγ2-GFP10, without (Control) or with either Flag-Ras CA or Flag-Ras DN (B) or Flag-MEK CA or Flag-MEK DN (C). BRET400-GFP10 between Gαi1-RLucII and Gγ2-GFP10 was measured after the addition of coel-400a, 3 min following the addition of CXCL12. Data are expressed as agonist-promoted BRET (ΔBRET; see Fig. S1A). (D) Schematic representation of the Obelin-based Ca2+ mobilization assay. (E and F) The increase in CXCL12-promoted intracellular calcium measured in HEK293T cells transfected with Obelin-Cherry in the absence (Control) or presence of the indicated Ras and MEK mutants. Luminescence was measured every second for 60 s after the injection of CXCL12 or calcium ionophore A23187. Bars represent the area under the curve calculated from the kinetics curves (Fig. S1B). (G and J) Schematic representations of the BRET-based ligand-induced GRK2 (G) and βarr2 (J) translocation. (H, I, K, and L) CXCL12-promoted BRET was measured in HEK293T cells transfected with CXCR4-RLucII and GRK2-GFP10 (H and I) or βarr2-GFP10 (K and L), in the absence (Control) or presence of the indicated Ras or MEK mutants. BRET400-GFP10 between CXCR4-RLucII and GRK2-GFP10 or βarr2-GFP10 was measured after the addition of coel-400a, 15 min after the addition of CXCL12. Data are expressed as agonist-promoted BRET (ΔBRET; see Fig. S1 C and D). In all cases, data shown represent the mean ± SEM of three independent experiments and were normalized to 100% of the control condition. Expression of CA or DN forms of Flag-Ras or Flag-MEK and the total ERK1/2 and ERK1/2 activation status [(p)ERK1/2], was assessed by immunoblotting. Representative experiments are shown below the graphs.*P < 0.05; **P < 0.01; ***P < 0.001; NS, not significant.
Fig. S1.
Fig. S1.
CXCR4 activates Gi calcium mobilization as well as GRK2 and βarr2 recruitment to the receptor. (A) Gi activation measured by BRET in HEK293T cells transfected with HA-CXCR4, Gαi1-RlucII, Gβ1, and Gγ2-GFP10. BRET400-GFP10 between Gαi1-RlucII and Gγ2-GFP10 was measured after the addition of coel-400a in the absence (vehicle) or presence of CXCL12. (B) Cytoplasmic calcium was measured in HEK293T cells transfected with Obelin-Cherry by measuring luminescence every second for 60 s after the injection of CXCL12 or calcium ionophore A23187. (C and D) GRK2 (C) and βarr2 (D) translocation was measured by BRET in HEK293T cells transfected with CXCR4-RlucII and GRK2-GFP10 (C) or βarr2-GFP10 (D). BRET400-GFP10 between CXCR4-RlucII and GRK2-GFP10 or βarr2-GFP10 was measured after the addition of coel-400a in the absence (Vehicle) or presence of CXCL12. Data shown represent the mean ± SEM of three independent experiments. Ligand-induced BRET (ΔBRET) represents the difference between the basal BRET and the BRET values following ligand stimulation and is indicated by black arrows. ***P < 0.001.
Fig. 2.
Fig. 2.
Activation of the ERK/MAPK pathway reduces cell-surface expression of CXCR4. (A) Schematic representation of the receptor cell-surface expression assay. PM, plasma membrane. (B and C) Cell-surface CXCR4 levels were detected in HEK293T cells stably expressing HA-CXCR4-vYFP transfected without (Control) or with the indicated Ras and MEK mutants. Cells were labeled with a primary anti-HA and secondary Alexa 647-coupled chicken anti-mouse IgG antibodies, without permeabilization. Cell-surface expression of HA-CXCR4-vYFP in the absence of CXCL12 stimulation was measured by dual-flow cytometry. vYFP emission represents CXCR4 total expression; Alexa Fluor 647 emission represents CXCR4 plasma membrane expression. The relative cell-surface expression (the ratio of Alexa:vYFP mean emissions) is calculated from the YFP+ cell population and is expressed as a percentage of the control condition. Data shown represent the mean ± SEM of three independent experiments. Expression of CA or DN forms of Flag-Ras or Flag-MEK and total ERK and ERK1/2 activation status [(p)ERK1/2] was assessed by immunoblotting. Representative experiments are shown below the graphs. **P < 0.01; NS, not significant.
Fig. 3.
Fig. 3.
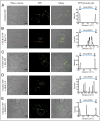
Activation of the ERK/MAPK pathway leads to the redistribution of CXCR4 into intracellular vesicles (sequestration). CXCR4-YFP localization was assessed by fluorescence confocal microscopy in HeLa cells transfected with CXCR4-YFP without (A) or with (BE) the indicated Ras (B and C) and MEK (D and E) mutants. (Scale bars, 10 µm.) Intensity as a function of the distance along a selected transversal section (red bar) was assessed using ImageJ software. Plots generated from phase-contrast images were used to identify the coordinates of the plasma membrane (PM) and the intracellular compartment of the cell. These coordinates are schematically indicated above the YFP intensity plots. Data shown are representative of more than 20 cells obtained from three independent experiments. Quantifications are presented in Fig. S2. A.U., arbitrary units.
Fig. S2.
Fig. S2.
Quantification of CXCR4 sequestration in the cytoplasmic compartment upon ERK1/2 activation. Intensity plots derived from 20 confocal fluorescence microscopy images obtained in three independent experiments (illustrated in Fig. 3) were analyzed to quantify CXCR4 localization at the cell membrane and inside the cell. Data shown represent the mean ± SEM of the 20 images and were normalized to the total fluorescence intensity (plasma membrane + intracellular compartment) set to 100% in each condition.
Fig. 4.
Fig. 4.
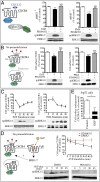
Acute pharmacological activation of the ERK/MAPK pathway blunts CXCR4 signaling by reducing receptor cell-surface localization. (A) CXCL12-promoted βarr2 translocation is measured by BRET in HEK293T cells transfected with CXCR4-RLucII and βarr2-GFP10. Cells were pretreated with PD184352 for 30 min before stimulation with EGF for 15 min or with PMA for 30 min. BRET400-GFP10 between CXCR4-RLucII and βarr2-GFP10 was measured after the addition of coel-400a, 15 min following the addition of CXCL12. (B) CXCR4 cell-surface expression levels were assessed by dual-flow cytometry in HEK293T cells stably expressing HA-CXCR4-vYFP that were pretreated or not with PD184352 for 30 min before stimulation with EGF for 15 min or with PMA for 30 min. (C) Kinetics of CXCR4 cell-surface level reduction and ERK1/2 activation following EGF or PMA treatments. (D) Kinetics of the reduction of CXCR4 cell-surface levels and ERK1/2 activation in HEK293T cells transfected with HA-CXCR4-vYFP and myc-V2R pretreated or not with PD184352 for 30 min before stimulation with AVP for the indicated time. (E) CXCR4 cell-surface expression level in SupT1 cells treated or not with EGF for 15 min. In all cases, data shown represent the mean ± SEM of at least three independent experiments and are normalized to 100% of the control conditions. Total ERK1/2 and ERK1/2 activation status [(p)ERK1/2] were assessed by immunoblotting. *P < 0.05; **P < 0.01; ***P < 0.001; NS, not significant.
Fig. 5.
Fig. 5.
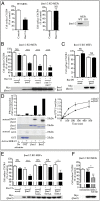
Activation of the ERK/MAPK pathway blunts signaling by reducing the cell-surface expression of V2R and AT1R. cAMP accumulation (GFP10-EPAC-RLucII) (A, Left), calcium mobilization (Obelin-Cherry) (B and C, Left), GRK2 recruitment (GRK2-GFP10) (A and B, Center Left), and βarr2 recruitment (βarr2-GFP10) (A and B, Center Right and C, Center) were measured in HEK293T cells transfected with V2R (A), AT1R (B), or FP (C) along with the appropriate biosensors in the absence (Control) or presence of the indicated MEK mutants. Cellular activities were measured by BRET, as in Fig.1, after the addition of AVP (A), AngII (B), or PGF-2 (C). Cell-surface expression (AC, Right) was measured by dual-flow cytometry in the absence of ligand stimulation as in Fig. 2. Data shown are the mean ± SEM of at least three independent experiments and were normalized to the control condition (100%).*P < 0.05; ***P < 0.001; NS, not significant.
Fig. 6.
Fig. 6.
ERK1/2-dependent βarr2 phosphorylation on S14 and T276 induces CXCR4 intracellular sequestration. (AC) CXCR4 cell-surface expression was assessed by dual-flow cytometry in WT MEFs or βarr1/2-KO MEFs transiently transfected with HA-CXCR4-vYFP in the absence (Control) or presence of the indicated Ras mutants (A) and with or without βarr1 and/or βarr2 complementation (B and C). (D) Phosphorylation of βarrs was performed with recombinant bovine βarr1 or βarr2 as a substrate and recombinant active ERK1 in the presence of [γ32P]-ATP for 15 min. The gel was stained with Coomassie, and 32P incorporation was quantified using a PhosphorImager (Left) or during kinetics using scintillation counting (Right). The data shown are representative of three independent experiments. (E and F) CXCR4 cell-surface expression was assessed by dual-flow cytometry in βarr1/2-KO MEFs transiently transfected with HA-CXCR4-vYFP, βarr2 WT, or the indicated βarr2 mutants, with or without Ras CA. Data shown represent the mean ± SEM of at least three independent experiments and were normalized to the control condition (100%). Expression of βarr2 WT and mutants were assayed by immunoblotting. *P < 0.05; **P < 0.01; ***P < 0.001; NS, not significant.
Fig. S3.
Fig. S3.
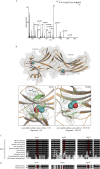
Ser14 and Thr276 residues of βarr2 are putative ERK1/2 phosphorylation sites. (A) LC-MS/MS of bovine βarr2: peptide VYTITPLLSNNR, MH+ 1469.721, m/z 735.8681, charge 2+. The characteristic peptide bond fragment ions, type b and y ions, are labeled. Eight microliters of sample were injected into a nanoflow Eksigent HPLC system for online C18 reversed-phase chromatographic separation coupled to an LTQ-Orbitrap Elite or Q Exactive mass spectrometer. The mass spectrometer was operated in the data-dependent mode, in which a full-scan MS was followed by MS/MS scans of the three most abundant ions with +2 to +4 charge states. (B) ERK1/2 putative phosphorylation sites Ser14 and Thr276. (Upper) Ribbon diagram of the βarr2 structure (PDB ID code 3P2D) depicted in orange. Putative sites for ERK1/2 phosphorylation (Ser14 and Thr276) are shown as spheres with carbon and oxygen atoms colored cyan and red, respectively. (Lower) Close-up of the structural environment of Ser14 and Thr276 putative phosphorylation sites. Side-chains of the amino acids in direct proximity of each site (within 4 Å) are highlighted in green and are shown as sticks and gray dots to represent their volume, illustrating the relative accessibility of each phosphorylation site. (C) Conservation between species of the three putative ERK1/2 phosphorylation sites in βarr2. (D) Conservation between human βarr1 and human βarr2 of the three putative ERK1/2 phosphorylation sites identified in βarr2.
Fig. S4.
Fig. S4.
βarr2 nonphosphorylatable and phosphomimetic mutants are both recruited to CXCR4 upon CXCL12 stimulation. BRET titration curves were performed in HEK293T cells transfected with a constant amount of CXCR4-RlucII and increasing amounts of βarr2 (WT, ST/2A, or ST/2D)-GFP10. BRET400-GFP10 between CXCR4-RlucII and βarr2 (WT, ST/2A, or ST/2D)-GFP10 was measured after the addition of coel-400a, 15 min following the addition of CXCL12. The table gives the BRET50 and the BRETmax of each condition extrapolated from the nonlinear regression fits. Data are expressed as agonist-promoted BRET (ΔBRET; Fig. S1D); the curves shown are derived from individual titration curves that are representative of three independent experiments. Error bars represent the mean ± SEM from three independent experiments.

Similar articles

Cited by

References

    1. Seger R, Krebs EG. The MAPK signaling cascade. FASEB J. 1995;9(9):726–735. - PubMed
    1. Roskoski R., Jr ERK1/2 MAP kinases: Structure, function, and regulation. Pharmacol Res. 2012;66(2):105–143. - PubMed
    1. Schlessinger J. Ligand-induced, receptor-mediated dimerization and activation of EGF receptor. Cell. 2002;110(6):669–672. - PubMed
    1. McKay MM, Morrison DK. Integrating signals from RTKs to ERK/MAPK. Oncogene. 2007;26(22):3113–3121. - PubMed
    1. Marinissen MJ, Gutkind JS. G-protein-coupled receptors and signaling networks: Emerging paradigms. Trends Pharmacol Sci. 2001;22(7):368–376. - PubMed

Publication types

MeSH terms

LinkOut - more resources