PD-L1 expression and prognostic impact in glioblastoma
- PMID: 26323609
- PMCID: PMC4724183
- DOI: 10.1093/neuonc/nov172
PD-L1 expression and prognostic impact in glioblastoma
Abstract
Background: Therapeutic targeting of the immune checkpoints cytotoxic T-lymphocyte-associated molecule-4 (CTLA-4) and PD-1/PD-L1 has demonstrated tumor regression in clinical trials, and phase 2 trials are ongoing in glioblastoma (GBM). Previous reports have suggested that responses are more frequent in patients with tumors that express PD-L1; however, this has been disputed. At issue is the validation of PD-L1 biomarker assays and prognostic impact.
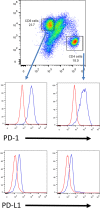
Methods: Using immunohistochemical analysis, we measured the incidence of PD-L1 expression in 94 patients with GBM. We categorized our results according to the total number of PD-L1-expressing cells within the GBMs and then validated this finding in ex vivo GBM flow cytometry with further analysis of the T cell populations. We then evaluated the association between PD-L1 expression and median survival time using the protein expression datasets and mRNA from The Cancer Genome Atlas.
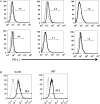
Results: The median percentage of PD-L1-expressing cells in GBM by cell surface staining is 2.77% (range: 0%-86.6%; n = 92), which is similar to the percentage found by ex vivo flow cytometry. The majority of GBM patients (61%) had tumors with at least 1% or more PD-L1-positive cells, and 38% had at least 5% or greater PD-L1 expression. PD-L1 is commonly expressed on the GBM-infiltrating T cells. Expression of both PD-L1 and PD-1 are negative prognosticators for GBM outcome.
Conclusions: The incidence of PD-L1 expression in GBM patients is frequent but is confined to a minority subpopulation, similar to other malignancies that have been profiled for PD-L1 expression. Higher expression of PD-L1 is correlated with worse outcome.
Keywords: PD-1; PD-L1; cancer stem cells; glioblastoma; immune suppression.
© The Author(s) 2015. Published by Oxford University Press on behalf of the Society for Neuro-Oncology. All rights reserved. For permissions, please e-mail: journals.permissions@oup.com.
Figures


Similar articles
-
Prognostic relevance of programmed cell death ligand 1 expression in glioblastoma.J Neurooncol. 2018 Feb;136(3):453-461. doi: 10.1007/s11060-017-2675-6. Epub 2017 Nov 16. J Neurooncol. 2018. PMID: 29147863
-
Distribution and prognostic relevance of tumor-infiltrating lymphocytes (TILs) and PD-1/PD-L1 immune checkpoints in human brain metastases.Oncotarget. 2015 Dec 1;6(38):40836-49. doi: 10.18632/oncotarget.5696. Oncotarget. 2015. PMID: 26517811 Free PMC article.
-
EGFR-ERK pathway regulates CSN6 to contribute to PD-L1 expression in glioblastoma.Mol Carcinog. 2020 May;59(5):520-532. doi: 10.1002/mc.23176. Epub 2020 Mar 5. Mol Carcinog. 2020. PMID: 32134157
-
Current advances in PD-1/PD-L1 axis-related tumour-infiltrating immune cells and therapeutic regimens in glioblastoma.Crit Rev Oncol Hematol. 2020 Jul;151:102965. doi: 10.1016/j.critrevonc.2020.102965. Epub 2020 Apr 24. Crit Rev Oncol Hematol. 2020. PMID: 32442903 Review.
-
Clinical Neuropathology mini-review 6-2015: PD-L1: emerging biomarker in glioblastoma?Clin Neuropathol. 2015 Nov-Dec;34(6):313-21. doi: 10.5414/np300922. Clin Neuropathol. 2015. PMID: 26501438 Free PMC article. Review.
Cited by
-
Methylome Profiling of PD-L1-Expressing Glioblastomas Shows Enrichment of Post-Transcriptional and RNA-Associated Gene Regulation.Cancers (Basel). 2022 Oct 31;14(21):5375. doi: 10.3390/cancers14215375. Cancers (Basel). 2022. PMID: 36358793 Free PMC article.
-
The splicing FK506-binding protein-51 isoform plays a role in glioblastoma resistance through programmed cell death ligand-1 expression regulation.Cell Death Discov. 2019 Sep 24;5:137. doi: 10.1038/s41420-019-0216-0. eCollection 2019. Cell Death Discov. 2019. PMID: 31583120 Free PMC article.
-
Checkpoint kinase 1/2 inhibition potentiates anti-tumoral immune response and sensitizes gliomas to immune checkpoint blockade.Nat Commun. 2023 Mar 22;14(1):1566. doi: 10.1038/s41467-023-36878-2. Nat Commun. 2023. PMID: 36949040 Free PMC article.
-
Pleomorphic xanthoastrocytoma: a brief review.CNS Oncol. 2019 Nov 1;8(3):CNS39. doi: 10.2217/cns-2019-0009. Epub 2019 Sep 19. CNS Oncol. 2019. PMID: 31535562 Free PMC article. Review.
-
The IFN-γ/PD-L1 axis between T cells and tumor microenvironment: hints for glioma anti-PD-1/PD-L1 therapy.J Neuroinflammation. 2018 Oct 17;15(1):290. doi: 10.1186/s12974-018-1330-2. J Neuroinflammation. 2018. PMID: 30333036 Free PMC article.
References
-
- Heimberger AB, Abou-Ghazal M, Reina-Ortiz C, et al. Incidence and prognostic impact of FoxP3+ regulatory T cells in human gliomas. Clin Cancer Res. 2008;14(16):5166–5172. - PubMed
-
- Fecci PE, Mitchell DA, Whitesides JF, et al. Increased regulatory T-cell fraction amidst a diminished CD4 compartment explains cellular immune defects in patients with malignant glioma. Cancer Res. 2006;66(6):3294–3302. - PubMed
Publication types
MeSH terms
Substances
Grants and funding
LinkOut - more resources
Full Text Sources
Other Literature Sources
Medical
Research Materials

