. 2015 Aug 27;162(5):961-73.
doi: 10.1016/j.cell.2015.07.056.

DNA-Demethylating Agents Target Colorectal Cancer Cells by Inducing Viral Mimicry by Endogenous Transcripts

Affiliations

DNA-Demethylating Agents Target Colorectal Cancer Cells by Inducing Viral Mimicry by Endogenous Transcripts

David Roulois et al. Cell. .

Abstract

DNA-demethylating agents have shown clinical anti-tumor efficacy via an unknown mechanism of action. Using a combination of experimental and bioinformatics analyses in colorectal cancer cells, we demonstrate that low-dose 5-AZA-CdR targets colorectal cancer-initiating cells (CICs) by inducing viral mimicry. This is associated with induction of dsRNAs derived at least in part from endogenous retroviral elements, activation of the MDA5/MAVS RNA recognition pathway, and downstream activation of IRF7. Indeed, disruption of virus recognition pathways, by individually knocking down MDA5, MAVS, or IRF7, inhibits the ability of 5-AZA-CdR to target colorectal CICs and significantly decreases 5-AZA-CdR long-term growth effects. Moreover, transfection of dsRNA into CICs can mimic the effects of 5-AZA-CdR. Together, our results represent a major shift in understanding the anti-tumor mechanisms of DNA-demethylating agents and highlight the MDA5/MAVS/IRF7 pathway as a potentially druggable target against CICs.


Figures

Figure 1
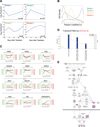
Figure 1. Transient low dose treatment of 5-AZA-CdR induces durable and DNA demethylation-independent activation of a gene-set enriched for interferon responsive genes and RIG-1 pathway
HCT116 cells were transiently treated with 0.3uM of 5-AZA-CdR for 24 hours (1 population doubling time). RNA was extracted before treatment and at day 5, 14, 24 and 42 after drug withdrawal and subjected to cDNA microarray. A) Expression profile for each of the four identified clusters. The solid line represents the median value for each group, while the dotted lines are the lower quartile (lower dotted line) and the upper quartile (upper dotted line) for each group. B) Kernel density plots showing the Pearson correlation (r) between gene expression and DNA methylation for each probe across the 42 days time-course experiment. The y-axis indicates the density of probes. C) Selected examples of genes from Group 1, Group 2, Group 3, and Group 4 are shown. Left y-axis represents the average expression level, and right y-axis represents the average DNA methylation level. The x-axis denotes time (in days) after 5-AZA-CdR withdrawal. Error bars represent the standard deviation D) Three most significant Canonical Pathways enriched at group 4 genes using Ingenuity Pathway Analysis. The significance value for each canonical pathway was calculated by Fisher’s exact test right-tailed. Left y-axis displays the -log of p-value. The orange points represent the ratio between the number of genes in Group 4 that belongs to that specific pathway by the total number of genes annotated to that specific pathway. E) Diagram of the canonical pathway entitled “Role of RIG1-like Receptors in Antiviral Innate Immunity”. Genes highlighted in pink belongs to Group 4. IPS-1 (MAVS) is a central node of the pathway, linking RIG-1/MDA5 receptors to IRF7. See also Figure S1.
Figure 2
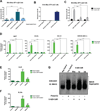
Figure 2. Transient low dose treatment of 5-AZA-CdR induces Type III Interferon production and activation of MAVS
A) B16-Blue™ IFN-α/β Cells (InvivoGen) were transiently treated with 0.3uM of 5-AZA-CdR for 24 hours. Activity of the ISG54 promoter enhanced by a multimeric ISRE was determined by measuring secreted alkaline phosphatase (SEAP). SEAP activity was measured at 640 nm when the QUANTI-blue substrate was provided. The results presented are from three independent experiments. Error bars represent the SD of three independent experiments. B) Supernatants from B16 cells transiently treated with 5-AZA-CdR or transfected with 0.5ug/ml of poly(I:C) were added to wild-type B16-Blue™ IFN-α/β cells (InvivoGen), and the presence of bioactive IFNs-α/β were determined by measuring SEAP activity 24 hours after adding the supernatants. Error bars represent the SD of three independent experiments. C) B16-Blue™ IFN-α/β Cells (InvivoGen) were transiently treated with 5-AZA-CdR in the presence or absence of the JAK1/JAK2 inhibitor Ruxolitinib (1uM) or the JAK3 inhibitor CP-690550 (1uM). SEAP activity was measured at 640nm. D) LIM1215 colorectal cancer cell line was transiently treated with 5-AZA-CdR in the presence or absence of the JAK1/JAK2 inhibitor Ruxolitinib (1uM) or the JAK3 inhibitor CP-690550 (1uM). Gene expression of four selected interferon responsive genes was measured by real-time qPCR at day 5. E-F) LIM1215 with or without shRNA against MAVS were transiently treated with 5-AZA-CdR. Gene expression of the Type III interferon genes IL29 (E) and IL28a (F) was measured by real-time qPCR at day 5. G) Mitochondrial extracts were prepared from LIM1215 cells treated with 5-AZA-CdR for the indicated time, or transfected with Poly(I:C), and then aliquots of the extracts were analyzed by SDD-AGE. **** p<0.0001; ** p<0.01 (One-way ANOVA) See also Figure S2.
Figure 3
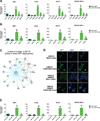
Figure 3. Activation of interferon responsive genes by transient low dose treatment of 5-AZA-CdR is dependent on MDA5/MAVS/IRF7 activation
LIM1215 colorectal cancer cell line with or without shRNA against RIG1 (A), MDA5 (A), or MAVS (B) was transiently treated with 5-AZA-CdR. Gene expression of four selected interferon responsive genes was measured by real-time qPCR at day 5. C) Upstream Regulators Analysis using Ingenuity Pathway Analysis reveals a significant overlap between Group 4 genes and IRF7 direct target genes (p-value: 5.09e-15). D) Confocal microscopy of LIM1215 cells after treatment with transient low dose of 5-AZA-CdR. Total IRF7 is stained in green, and nuclei are stained in blue (DAPI). There is increased IRF7 expression and nuclear translocation in 5-AZA-CdR treated WT cells. E) LIM1215 colorectal cancer cell line with or without shRNA against IRF7 was transiently treated with 5-AZA-CdR. Gene expression of four selected interferon responsive genes was measured by real-time qPCR at day 5. Y-axis represents the relative expression (in % of control) compared to the wild-type untreated control. Error bars represent the SD of at least three independent experiments. ns, non-significant; * p<0.05; ** p<0.01; **** p<0.0001 (One-way ANOVA). See also Figure S3.
Figure 4
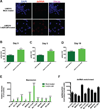
Figure 4. Increased dsRNA by transient low dose treatment of 5-AZA-CdR
A) Confocal microscopy of LIM1215 cells 3 days after treatment with transient low dose of 5-AZA-CdR. Total dsRNA is stained in red, and nuclei are stained in blue (DAPI). There is increased dsRNA expression in the cytoplasm of 5-AZA-CdR treated cells. B-D) Quantification of the dsRNA performed by Measuring Cell Fluorescence using ImageJ software 3 days (B), 5 days (C) or 10 days (D) after 5-AZA-CdR treatment. Corrected total cell fluorescence (CTCF) was calculated using the following formula. CTCF = Integrated Density – (Area of selected cell X Mean fluorescence of background readings). **** p<0.0001, * p<0.05 (two-tailed T test). E) LIM1215 was transiently treated with 5-AZA-CdR. Expression level of ten selected ERVs was measured by real-time qPCR at day 5. **** p<0.0001; *** p<0.001; * p<0.05 (Two-way ANOVA) F) Total RNA was extracted from 5-AZA-CdR treated cells. RNA was then digested or not with 50ug/ml RNase A in high salt concentration (NaCl 0.35M) for 30 minute. Enrichment of dsRNA over ssRNA was then calculated by normalizing the delta Ct between RNAse A treated and non-treated of ERVs (dsRNA) against beta-actin (ssRNA). See also Figure S4.
Figure 5
Figure 5. Transient 5-AZA-CdR treatment prolonged effect on cell growth and self-renew is dependent on MDA5/MAVS/IRF7 activation
A-C) Population doubling time of LIM1215 with or without MDA5 (A), MAVS (B), and IRF7 (C) knockdown. The y-axis denotes population-doubling time (in hours) as a percentage of the vehicle-treated WT controls. The x-axis represents time (in days) after 5-AZA-CdR was withdrawal. Error bars represent the SD of three independent experiments. D) Schematic representation of the approach used to measure the sphere-initiating frequency after transient low dose 5-AZA-CdR treatment (see Experimental Procedures). E-F) Frequency of LIM1215 CICs before and after low dose transient 5-AZA-CdR treatment measured by in-vitro limiting dilution assay in wild-type (E) or shMAVS (F) cells. The y-axis denotes the confidence intervals (lower, estimate and upper) for CIC frequency. G) Schematic representation of the approach used to measure the cancer-initiating cells frequency in vivo after transient low dose 5-AZA-CdR treatment (see Experimental Procedures). H-I) Frequency of LIM1215 CICs before and after low dose transient 5-AZA-CdR treatment measured by in-vivo limiting dilution assay in wild-type (H) or shMAVS (I) cells. The y-axis denotes the confidence intervals (lower, estimate and upper) for CIC frequency. * p<0.05; ** p<0.01; *** p<0.001. Multiple t tests were used to test for difference in population doubling time. Pairwise chi-squared test was used to test for difference in CIC frequency. See also Figure S5.
Figure 6
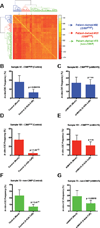
Figure 6. Transient 5-AZA-CdR treatment reduces the frequency of primary colorectal CICs independent of CIMP status, and this activity is dependent on MAVS activation
A) Colorectal patient-derived cells were classified accordingly their CpG Island Methylator Phenotype (CIMP) into CIMPhigh (Sample 92), CIMPlow (Sample 181) and non-CIMP (Sample 73). Primary tissue DNA methylation data and CIMP classification were obtained from (Hinoue et al., 2012). Heatmap shows the pairwise correlation using Spearman correlation method of each sample. B, D and F) Frequency of colorectal CICs before and after low dose transient 5-AZA-CdR treatment measured by in-vitro limiting dilution assay in MAVS wild type cells. Patient-derived cells obtained from a CIMPhigh (sample 92) (B), a CIMPlow (sample 181) (D) and a non-CIMP (sample 73) (F) were used. C, E and G) Frequency of colorectal CICs before and after low dose transient 5-AZA-CdR treatment measured by in-vitro limiting dilution assay in MAVS knocked-down (shMAVS) cells. Patient-derived cells obtained from a CIMPhigh (sample 92) (C), a CIMPlow (sample 181) (E) and a non-CIMP (sample 73) (G) were used. The y-axis denotes the confidence intervals (lower, estimate and upper) for CIC frequency. Pairwise chi-squared test was used to test for difference in CIC frequency. See also Figure S6.
Figure 7
Figure 7. RIG1 or MDA5 agonists reduce the frequency of primary colorectal CICs independent of CIMP status
Frequency of colorectal CICs before and after transfection with 0.5 ug/ml of low molecular weight (LMW – RIG1 agonist) or high molecular weight (HMW – MDA5 agonist) poly(I:C) measured by in-vitro limiting dilution assay. Patient-derived cells obtained from a CIMPhigh (sample 92) (A), a CIMPlow (sample 181) (B), and a non-CIMP (sample 73) (C) were used. The y-axis denotes the confidence intervals (lower, estimate and upper) for CIC frequency. Pairwise chi-squared test was used to test for difference in CIC frequency. See also Figure S7.

Comment in

Similar articles

Cited by

References

    1. Ahuja N, Easwaran H, Baylin SB. Harnessing the potential of epigenetic therapy to target solid tumors. The Journal of clinical investigation. 2014;124:56–63. - PMC - PubMed
    1. Barbalat R, Ewald SE, Mouchess ML, Barton GM. Nucleic acid recognition by the innate immune system. Annual review of immunology. 2011;29:185–214. - PubMed
    1. Besch R, Poeck H, Hohenauer T, Senft D, Hacker G, Berking C, Hornung V, Endres S, Ruzicka T, Rothenfusser S, et al. Proapoptotic signaling induced by RIG-I and MDA-5 results in type I interferon-independent apoptosis in human melanoma cells. The Journal of clinical investigation. 2009;119:2399–2411. - PMC - PubMed
    1. Dalerba P, Dylla SJ, Park IK, Liu R, Wang X, Cho RW, Hoey T, Gurney A, Huang EH, Simeone DM, et al. Phenotypic characterization of human colorectal cancer stem cells. Proceedings of the National Academy of Sciences of the United States of America. 2007;104:10158–10163. - PMC - PubMed
    1. De Carvalho DD, Sharma S, You JS, Su SF, Taberlay PC, Kelly TK, Yang X, Liang G, Jones PA. DNA methylation screening identifies driver epigenetic events of cancer cell survival. Cancer cell. 2012;21:655–667. - PMC - PubMed

Publication types

MeSH terms

Associated data