Targeting activating mutations of EZH2 leads to potent cell growth inhibition in human melanoma by derepression of tumor suppressor genes
- PMID: 26304929
- PMCID: PMC4694971
- DOI: 10.18632/oncotarget.4809
Targeting activating mutations of EZH2 leads to potent cell growth inhibition in human melanoma by derepression of tumor suppressor genes
Abstract
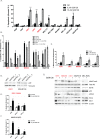
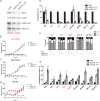
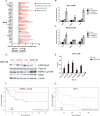
The epigenetic modifier EZH2 is part of the polycomb repressive complex that suppresses gene expression via histone methylation. Activating mutations in EZH2 are found in a subset of melanoma that contributes to disease progression by inactivating tumor suppressor genes. In this study we have targeted EZH2 with a specific inhibitor (GSK126) or depleted EZH2 protein by stable shRNA knockdown. We show that inhibition of EZH2 has potent effects on the growth of both wild-type and EZH2 mutant human melanoma in vitro particularly in cell lines harboring the EZH2Y646 activating mutation. This was associated with cell cycle arrest, reduced proliferative capacity in both 2D and 3D culture systems, and induction of apoptosis. The latter was caspase independent and mediated by the release of apoptosis inducing factor (AIFM1) from mitochondria. Gene expression arrays showed that several well characterized tumor suppressor genes were reactivated by EZH2 inhibition. This included activating transcription factor 3 (ATF3) that was validated as an EZH2 target gene by ChIP-qPCR. These results emphasize a critical role for EZH2 in the proliferation and viability of melanoma and highlight the potential for targeted therapy against EZH2 in treatment of patients with melanoma.
Keywords: EZH2; H3K27me3; epigenetics; melanoma; targeted therapy.
Conflict of interest statement
GAM receives research support from Pfizer, Millennium, Novartis and uncompensated consulting Roche-Genentech, GSK, Amgen, Novartis, BMS, Merck. The other authors declare no conflict of interest.
Figures


Similar articles
-
EZH2 inhibition as a therapeutic strategy for lymphoma with EZH2-activating mutations.Nature. 2012 Dec 6;492(7427):108-12. doi: 10.1038/nature11606. Epub 2012 Oct 10. Nature. 2012. PMID: 23051747
-
EZH2: an emerging role in melanoma biology and strategies for targeted therapy.Pigment Cell Melanoma Res. 2015 Jan;28(1):21-30. doi: 10.1111/pcmr.12280. Epub 2014 Jun 27. Pigment Cell Melanoma Res. 2015. PMID: 24912396 Review.
-
Yin Yang 1-mediated epigenetic silencing of tumour-suppressive microRNAs activates nuclear factor-κB in hepatocellular carcinoma.J Pathol. 2016 Apr;238(5):651-64. doi: 10.1002/path.4688. J Pathol. 2016. PMID: 26800240
-
Epigenetic reprogramming by tumor-derived EZH2 gain-of-function mutations promotes aggressive 3D cell morphologies and enhances melanoma tumor growth.Oncotarget. 2015 Feb 20;6(5):2928-38. doi: 10.18632/oncotarget.2758. Oncotarget. 2015. PMID: 25671303 Free PMC article.
-
Role of EZH2 histone methyltrasferase in melanoma progression and metastasis.Cancer Biol Ther. 2016 Jun 2;17(6):579-91. doi: 10.1080/15384047.2016.1167291. Epub 2016 Apr 22. Cancer Biol Ther. 2016. PMID: 27105109 Free PMC article. Review.
Cited by
-
Lysine Methyltransferase NSD1 and Cancers: Any Role in Melanoma?Cancers (Basel). 2022 Oct 5;14(19):4865. doi: 10.3390/cancers14194865. Cancers (Basel). 2022. PMID: 36230787 Free PMC article. Review.
-
Epigenetic regulation of cancer biology and anti-tumor immunity by EZH2.Oncotarget. 2016 Dec 20;7(51):85624-85640. doi: 10.18632/oncotarget.12928. Oncotarget. 2016. PMID: 27793053 Free PMC article. Review.
-
An actionable axis linking NFATc2 to EZH2 controls the EMT-like program of melanoma cells.Oncogene. 2019 May;38(22):4384-4396. doi: 10.1038/s41388-019-0729-2. Epub 2019 Feb 1. Oncogene. 2019. PMID: 30710146 Free PMC article.
-
Somatic Copy Number Amplification and Hyperactivating Somatic Mutations of EZH2 Correlate With DNA Methylation and Drive Epigenetic Silencing of Genes Involved in Tumor Suppression and Immune Responses in Melanoma.Neoplasia. 2016 Feb;18(2):121-32. doi: 10.1016/j.neo.2016.01.003. Neoplasia. 2016. PMID: 26936398 Free PMC article.
-
Regulation of cancer epigenomes with a histone-binding synthetic transcription factor.NPJ Genom Med. 2017;2:1. doi: 10.1038/s41525-016-0002-3. Epub 2017 Jan 9. NPJ Genom Med. 2017. PMID: 28919981 Free PMC article.
References
-
- Baylin SB. DNA methylation and gene silencing in cancer. Nat Clin Pract Oncol. 2005;2:S4–11. - PubMed
-
- Takeshima H, Wakabayashi M, Hattori N, Yamashita S, Ushijima T. Identification of co-existence of DNA methylation and H3K27me3 specifically in cancer cells as a promising target for epigenetic therapy. Carcinogenesis. 2014;4 - PubMed
Publication types
MeSH terms
Substances
Grants and funding
LinkOut - more resources
Full Text Sources
Other Literature Sources
Medical
Molecular Biology Databases
Miscellaneous

