. 2015 Sep 3;59(5):719-31.
doi: 10.1016/j.molcel.2015.07.011. Epub 2015 Aug 20.

MacroH2A1 and ATM Play Opposing Roles in Paracrine Senescence and the Senescence-Associated Secretory Phenotype

Affiliations

MacroH2A1 and ATM Play Opposing Roles in Paracrine Senescence and the Senescence-Associated Secretory Phenotype

Hongshan Chen et al. Mol Cell. .

Abstract

Oncogene-induced senescence (OIS) is a tumor-suppressive mechanism typified by stable proliferative arrest, a persistent DNA damage response, and the senescence-associated secretory phenotype (SASP), which helps to maintain the senescent state and triggers bystander senescence in a paracrine fashion. Here, we demonstrate that the tumor suppressive histone variant macroH2A1 is a critical component of the positive feedback loop that maintains SASP gene expression and triggers the induction of paracrine senescence. MacroH2A1 undergoes dramatic genome-wide relocalization during OIS, including its removal from SASP gene chromatin. The removal of macroH2A1 from SASP genes results from a negative feedback loop activated by SASP-mediated endoplasmic reticulum (ER) stress. ER stress leads to increased reactive oxygen species and persistent DNA damage response including activation of ATM, which mediates removal macroH2A1 from SASP genes. Together, our findings indicate that macroH2A1 is a critical control point for the regulation of SASP gene expression during senescence.


Figures

Figure 1
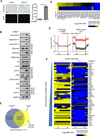
Figure 1. MacroH2A1 undergoes large-scale genome-wide rearrangement upon OIS
(A) Left, representative SA-β-gal and DAPI counterstaining of IMR90 cells subjected to retroviral-mediated expression of H-RasV12 or empty vector as a control for 14 days. Scale bar represents 200 µm. Right, histogram depicting the percentage of SA-β-gal positive cells. Error bars, s.e.m. (n = 3 independent cell passages and retroviral infections). *p < 0.05 from two-tailed Student’s t-tests. (B) Immunoblots for macroH2A1, various histone marks, DDR factors and cell cycle inhibitors from IMR90 cells treated as in (A). (C) Two-way Venn diagrams depicting the overlap between ChIP-seq identified bound regions for macroH2A1 in IMR90 cells treated as in (A). Numbers indicate the DNA coverage (Gb) and percentage of DNA in each section. (D) Heat map depicting the log2(odds ratio) for the overlap between macroH2A1-enriched domains identified in IMR90 cells treated as in (A) and 26 histone PTMs. (E) Metagene analysis of ChIP-seq data for macroH2A1 from IMR90 cells treated as in (A). Left, all autosomal protein coding genes. Right, fifty-one SASP genes defined from gene expression microarray data. The data represent the average signal in ten 1-kb windows upstream of the TSS, 30 windows spanning the gene body and ten 1-kb windows downstream of the end of the gene. The location of the TSS and the end of the gene were depicted by the left and right vertical dotted line respectively. Error bars, s.e.m. (n = 17,556 and 51 for red and black curves respectively). (F) Heat map of macroH2A1 occupancy in IMR90 cells treated as in (A) for the 51 individual SASP genes. The data are represented as ten 1 kb windows upstream of the TSS, 30 windows spanning the gene body, and ten 1 kb windows downstream of the end of the gene. See also Figure S1.
Figure 2
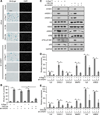
Figure 2. MacroH2A1 is required for SASP gene expression and persistent DDR during OIS and paracrine senescence
(A) Representative SA-β-gal and DAPI counterstaining of IMR90 cells expressing an shRNA against luciferase (Luc KD, as a control) or macroH2A1 (mH2A1 KD) subjected to retroviral-mediated expression of H-RasV12 for OIS or empty vector as a control for 14 days or subjected to paracrine senescence with cultured media from H-RasV12–mediated senescent IMR90 cells (OIS-CM) or cultured media from IMR90 cells expressing empty vector (as a control, N-CM) for 14 days, as indicated. Scale bar represents 200 µm. (B) Histogram depicting the percentage of SA-β-gal positive-staining of cells described in (A). Error bars, s.e.m. (n = 3 independent cell passages and retroviral infections). *p < 0.05 from two-tailed Student’s t-tests. (C) Immunoblots for macroH2A1, DDR factors and p53 from cells as described in (A). (D, E) Reverse transcription coupled to qPCR (RT-qPCR) of IMR90 cells described in (A) for the indicated genes during OIS (D) or paracrine senescence (E). Error bars, s.e.m. (n = 3 independent cell passages and retroviral infections). *p < 0.05 from two-tailed Student’s t-tests. See also Figure S2.
Figure 3
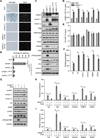
Figure 3. Ectopic expression of macroH2A1.1 specifically triggers senescence, SASP expression and persistent DDR
(A) Representative SA-β-gal and DAPI counterstaining of IMR90 cells after retroviral transduction with expression constructs for GFP (as a control), macroH2A1.1, macroH2A1.2 or two macroH2A1.1 point mutants (G224E and G314E) that are incapable of interacting with PAR isoforms, for 14 days. (B) Histogram depicting the percentage of SA-β-gal positive-staining of cells described in (A). Error bars, s.e.m. (n = 3 independent cell passages and retroviral infections). *p < 0.05 from two-tailed Student’s t-tests. (C) Immunoblots for macroH2A1, various histone marks, DDR factors and cell cycle inhibitors from IMR90 cells lines described in (A). (D, E) ChIP-qPCR for macroH2A1 (D) and H3 (E) from IMR90 cells expressing GFP or macroH21.1 at the indicated SASP genes. The horizontal dotted line indicates upper limit of the 95% confidence interval of the signal from no-antibody control ChIPs. Error bars, s.e.m. (n= 3 independent cell passages and retroviral infections). * p < 0.05 from a two-tailed Student’s t-test. (F) RT–qPCR for the indicated genes from IMR90 cells described in (D) for the indicated SASP genes. Error bars, s.e.m. (n = 3 independent cell passages and retroviral infections). *p < 0.05 from two-tailed Student’s t-tests. (G) Immunoblots for macroH2A1 and DDR factors from IMR90 cells subjected to retroviral-mediated expression of H-RasV12 (+) for OIS or empty vector (−) as a control and 10 µM PJ34 (+) or DMSO (−) as a control as indicated for 3 days. (H) RT-qPCR for the indicated genes from IMR90 cells after retroviral transduction with expression constructs for macroH2A1.1 (+) or GFP (−) as a control and 10 µM PJ34 (+) or DMSO (−) as a control as indicated for 3 days. (I) RT-qPCR for the indicated genes from IMR90 cells treated as in (G).
Figure 4
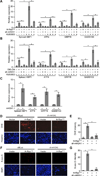
Figure 4. Senescence-associated ER stress, ROS and oxidative DNA damage requires macroH2A1
(A) RT-qPCR for the indicated UPR genes from IMR90 cells expressing shRNA against luciferase as a control (−) or macroH2A1 (+) subjected to retroviral-mediated expression of H-RasV12 (+) for OIS or empty vector (−) as a control. Where indicated cells were treated with 10 µM of the ATM inhibitor KU55933 (+) or DMSO (−) as a control for 3 days. Error bars, s.e.m. (n = 3 independent cell passages and retroviral infections). *p < 0.05 from two-tailed Student’s t-tests. (B) As for (A) except cells were treated with SASP-containing conditioned media from H-RasV12-mediated senescent IMR90 cells (OIS-CM, +) or conditioned media from IMR90 cells transduced with empty vector (−) as a control. (C) RT-qPCR for the indicated UPR genes from IMR90 cells after retroviral transduction with expression constructs for GFP (−) as a control or macroH2A1.1 (+) for 14 days. (D) Representative fluorescence microscopy images for ROS detection in IMR90 cells expressing shRNA against luciferase as a control (−) or macroH2A1 (+) subjected to retroviral-mediated expression of H-RasV12 (+) for OIS or empty vector (−) as a control. Cells were treated with 10 µM DHE for 30 min prior to collection and counterstained with Hoechst. Scale bar represents 200 µm. (E) Histogram depicting the average fluorescence of cells described in (D). Error bars, s.e.m. (n = 3 independent cell passages and retroviral infections). *p < 0.05 from two-tailed Student’s t-tests. (F) Representative immunofluorescence microscopy for 8-oxo-dG and counterstained with DAPI in IMR90 cells treated as described in (D). Scale bar represents 200 µm. (G) Histogram depicting the average fluorescence of cells described in (F). Error bars, s.e.m. (n = 3 independent cell passages and retroviral infections). *p < 0.05 from two-tailed Student’s t-tests. See also Figure S3.
Figure 5
Figure 5. ER stress represses SASP gene expression in a ROS dependent manner
(A) Immunoblots for macroH2A1 and the indicated DDR factors from IMR90 cells treated with 0.25 µM of the ER stress inducing agent, thapsigargin, for the indicated times. (B) RT-qPCR for the indicated SASP genes from IMR90 cells subjected to retroviral-mediated expression of H-RasV12 (+) for OIS or empty vector (−) as a control and, where indicated, treated with 0.25 µM of the ER stress inducer thapsigargin (+) or DMSO (−) for 3 days. Error bars, s.e.m. (n = 3 independent cell passages and retroviral infections). *p < 0.05 from two-tailed Student’s t-tests. (C) Immunoblots for macroH2A1 and the indicated DDR factors from IMR90 cells subjected to retroviral-mediated expression of H-RasV12 (+) for OIS or empty vector (−) as a control and, where indicated, treated with 10 mM of the antioxidant N-acetyl-cysteine (NAC, +) or DMSO (−) for 3 days. (D) RT-qPCR for the indicated SASP genes from IMR90 cells treated as in (C). Error bars, s.e.m. (n = 3 independent cell passages and retroviral infections). *p < 0.05 from two-tailed Student’s t-tests. See also Figure S4.
Figure 6
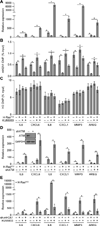
Figure 6. ATM represses SASP expression during OIS by triggering removal of macroH2A1 from SASP genes
(A) RT-qPCR for the indicated SASP genes from IMR90 cells subjected to retroviral-mediated expression of H-RasV12 (+) for OIS or empty vector (−) as a control and where indicated cells were treated with 10 µM of the ATM inhibitor KU55933 (+) or DMSO (−) as a control for 3 days. Error bars, s.e.m. (n = 3 independent cell passages and retroviral infections). *p < 0.05 from two-tailed Student’s t-tests. (B,C) ChIP-qPCR for macroH2A1 (B) and H3 (C) from IMR90 cells treated as described in (A). Error bars, s.e.m. (n = 3 independent cell passages and retroviral infections). *p < 0.05 from two-tailed Student’s t-tests. (D) RT-qPCR for the indicated SASP genes from IMR90 cells expressing an shRNA against ATM (+, shATM) or luciferase (−, shLuc) as a control subjected to retroviral-mediated expression of H-RasV12 (+) for OIS or empty vector (−) as a control for 3 days. Error bars, s.e.m. (n = 3 independent cell passages and retroviral infections). *p < 0.05 from two-tailed Student’s t-tests. Inset, immunoblots for ATM and GAPDH from shLuc (−) and shATM (+) IMR90 cells. (E) RT-qPCR for the indicated SASP genes from IMR90 cells expressing an shRNA against macroH2A1 (+) or luciferase (−) as a control subjected to retroviral-mediated expression of H-RasV12 for OIS for 3 days. Error bars, s.e.m. (n = 3 independent cell passages and retroviral infections). *p < 0.05 from two-tailed Student’s t-tests. See also Figure S5.
Figure 7
Figure 7. Model depicting the role of macroH2A1 as a critical control point in the regulation of SASP gene expression
(1) Activated Ras both mediates a proliferative arrest and upregulates the expression of macroH2A1. (2) Increased macroH2A1.1 levels promote the expression of SASP genes. (3) Secreted SASP factors can act in an autocrine or paracrine fashion by engaging cell surface receptors, such as CXCR2, which can upregulate the expression of macroH2A1, forming a positive feedback loop which supports SASP gene expression. (4) The SASP leads to ER stress which triggers ROAMM (reactive oxygen and ATM-mediated macroH2A1 mobilization). The ROS-mediated DNA damage activates ATM which triggers the removal of macroH2A1 from SASP gene chromatin, providing negative feedback on the expression of SASP gene expression. (5) The activation of ATM can also contribute to the senescent proliferative arrest in a manner similar to activated Ras.

Comment in

Similar articles

Cited by

References

    1. Acosta J, O’Loghlen A, Banito A, Raguz S, Gil J. Control of senescence by CXCR2 and its ligands. Cell Cycle. 2008a;7:2956–2959. - PubMed
    1. Acosta JC, O’Loghlen A, Banito A, Guijarro MV, Augert A, Raguz S, Fumagalli M, Da Costa M, Brown C, Popov N, et al. Chemokine signaling via the CXCR2 receptor reinforces senescence. Cell. 2008b;133:1006–1018. - PubMed
    1. Acosta JC, Banito A, Wuestefeld T, Georgilis A, Janich P, Morton JP, Athineos D, Kang T-W, Lasitschka F, Andrulis M, et al. A complex secretory program orchestrated by the inflammasome controls paracrine senescence. Nat. Cell Biol. 2013;15:978–990. - PMC - PubMed
    1. Baker DJ, Wijshake T, Tchkonia T, LeBrasseur NK, Childs BG, van de Sluis B, Kirkland JL, van Deursen JM. Clearance of p16Ink4a-positive senescent cells delays ageing-associated disorders. Nature. 2011;479:232–236. - PMC - PubMed
    1. Campisi J. Senescent cells, tumor suppression, and organismal aging: good citizens, bad neighbors. Cell. 2005;120:513–522. - PubMed

Publication types