

Does heart rate variability reflect the systemic inflammatory response in a fetal sheep model of lipopolysaccharide-induced sepsis?
- PMID: 26290042
- PMCID: PMC5362269
- DOI: 10.1088/0967-3334/36/10/2089
Does heart rate variability reflect the systemic inflammatory response in a fetal sheep model of lipopolysaccharide-induced sepsis?
Abstract
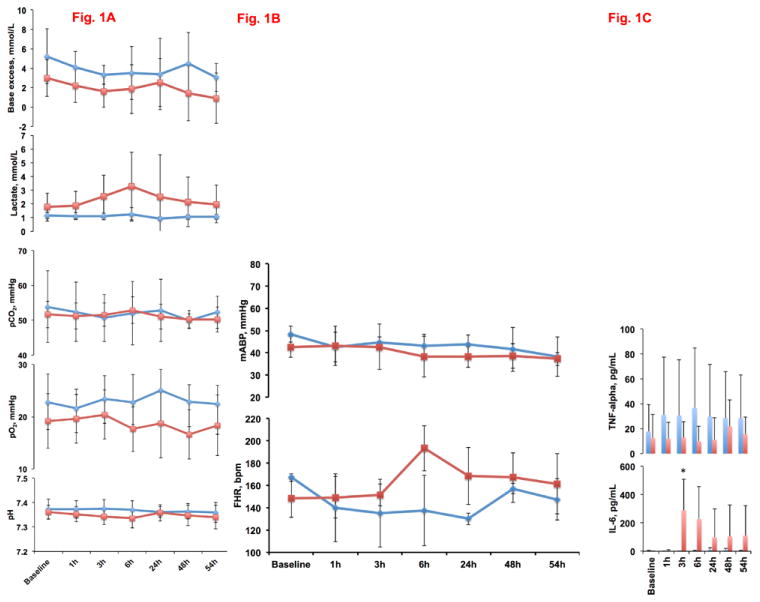
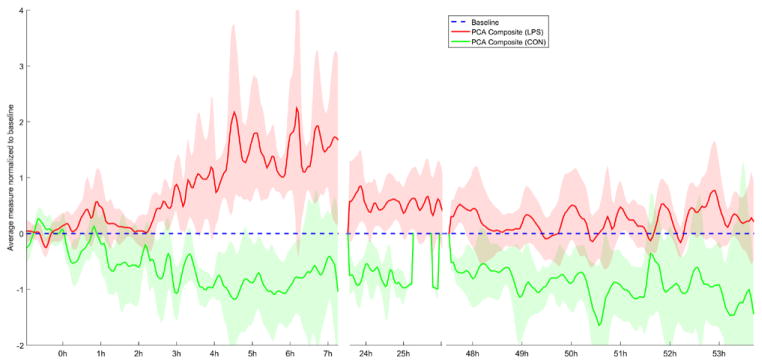
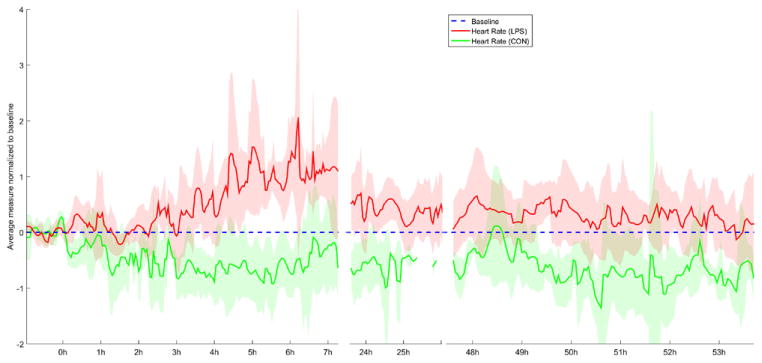
Fetal inflammatory response occurs during chorioamnionitis, a frequent and often subclinical inflammation associated with increased risk for brain injury and life-lasting neurologic deficits. No means of early detection exist. We hypothesized that systemic fetal inflammation without septic shock will be reflected in alterations of fetal heart rate (FHR) variability (fHRV) distinguishing baseline versus inflammatory response states. In chronically instrumented near-term fetal sheep (n = 24), we induced an inflammatory response with lipopolysaccharide (LPS) injected intravenously (n = 14). Ten additional fetuses served as controls. We measured fetal plasma inflammatory cytokine IL-6 at baseline, 1, 3, 6, 24 and 48 h. 44 fHRV measures were determined continuously every 5 min using continuous individualized multi-organ variability analysis (CIMVA). CIMVA creates an fHRV measures matrix across five signal-analytical domains, thus describing complementary properties of fHRV. Using principal component analysis (PCA), a widely used technique for dimensionality reduction, we derived and quantitatively compared the CIMVA fHRV PCA signatures of inflammatory response in LPS and control groups. In the LPS group, IL-6 peaked at 3 h. In parallel, PCA-derived fHRV composite measures revealed a significant difference between LPS and control group at different time points. For the LPS group, a sharp increase compared to baseline levels was observed between 3 h and 6 h, and then abating to baseline levels, thus tracking closely the IL-6 inflammatory profile. This pattern was not observed in the control group. We also show that a preselection of fHRV measures prior to the PCA can potentially increase the difference between LPS and control groups, as early as 1 h post LPS injection. We propose a fHRV composite measure that correlates well with levels of inflammation and tracks well its temporal profile. Our results highlight the potential role of HRV to study and monitor the inflammatory response non-invasively over time.
Figures
Similar articles
-
Temporal Patterns in Sheep Fetal Heart Rate Variability Correlate to Systemic Cytokine Inflammatory Response: A Methodological Exploration of Monitoring Potential Using Complex Signals Bioinformatics.PLoS One. 2016 Apr 21;11(4):e0153515. doi: 10.1371/journal.pone.0153515. eCollection 2016. PLoS One. 2016. PMID: 27100089 Free PMC article.
-
Biphasic changes in fetal heart rate variability in preterm fetal sheep developing hypotension after acute on chronic lipopolysaccharide exposure.Am J Physiol Regul Integr Comp Physiol. 2014 Aug 15;307(4):R387-95. doi: 10.1152/ajpregu.00110.2014. Epub 2014 Jun 18. Am J Physiol Regul Integr Comp Physiol. 2014. PMID: 24944248
-
Subclinical decelerations during developing hypotension in preterm fetal sheep after acute on chronic lipopolysaccharide exposure.Sci Rep. 2015 Nov 5;5:16201. doi: 10.1038/srep16201. Sci Rep. 2015. PMID: 26537688 Free PMC article.
-
Physiological control of fetal heart rate variability during labour: implications and controversies.J Physiol. 2022 Feb;600(3):431-450. doi: 10.1113/JP282276. Epub 2022 Jan 17. J Physiol. 2022. PMID: 34951476 Review.
-
Heart Rate Variability Code: Does It Exist and Can We Hack It?Bioengineering (Basel). 2023 Jul 10;10(7):822. doi: 10.3390/bioengineering10070822. Bioengineering (Basel). 2023. PMID: 37508849 Free PMC article. Review.
Cited by
-
Myalgic encephalomyelitis or chronic fatigue syndrome: how could the illness develop?Metab Brain Dis. 2019 Apr;34(2):385-415. doi: 10.1007/s11011-019-0388-6. Epub 2019 Feb 13. Metab Brain Dis. 2019. PMID: 30758706 Free PMC article. Review.
-
Heart Rate Variability in the Perinatal Period: A Critical and Conceptual Review.Front Neurosci. 2020 Sep 25;14:561186. doi: 10.3389/fnins.2020.561186. eCollection 2020. Front Neurosci. 2020. PMID: 33071738 Free PMC article. Review.
-
Early heart rate variability changes during acute fetal inflammatory response syndrome: An experimental study in a fetal sheep model.PLoS One. 2023 Nov 30;18(11):e0293926. doi: 10.1371/journal.pone.0293926. eCollection 2023. PLoS One. 2023. PMID: 38032884 Free PMC article.
-
Heart Rate as a Non-Invasive Biomarker of Inflammation: Implications for Digital Health.Front Immunol. 2022 Jun 2;13:930445. doi: 10.3389/fimmu.2022.930445. eCollection 2022. Front Immunol. 2022. PMID: 35720409 Free PMC article. No abstract available.
-
Effects of maternal ritodrine hydrochloride administration on the heart rate of preterm fetal sheep with intraamniotic inflammation.PLoS One. 2022 Mar 31;17(3):e0265872. doi: 10.1371/journal.pone.0265872. eCollection 2022. PLoS One. 2022. PMID: 35358222 Free PMC article.
References
-
- Cabal LA, Siassi B, Zanini B, Hodgman JE, Hon EE. Factors affecting heart rate variability in preterm infants. Pediatrics. 1980;65:50–6. - PubMed
-
- Chan CJ, Summers KL, Chan NG, Hardy DB, Richardson BS. Cytokines in umbilical cord blood and the impact of labor events in low-risk term pregnancies. Early Hum Dev. 2013;89:1005–10. - PubMed
Publication types
MeSH terms
Substances
Grants and funding
LinkOut - more resources
Full Text Sources
Other Literature Sources
Medical