

On the Estimation of Disability-Free Life Expectancy: Sullivan' Method and Its Extension
- PMID: 26279593
- PMCID: PMC4533834
- DOI: 10.1198/016214507000000040
On the Estimation of Disability-Free Life Expectancy: Sullivan' Method and Its Extension
Abstract
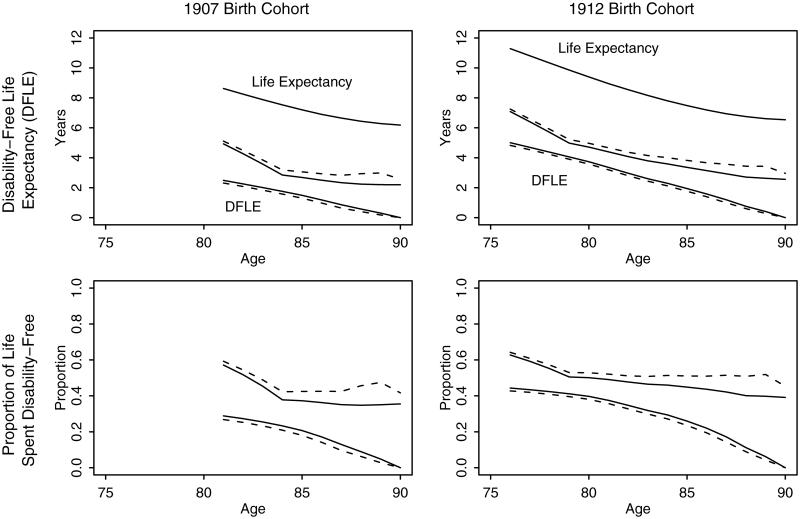
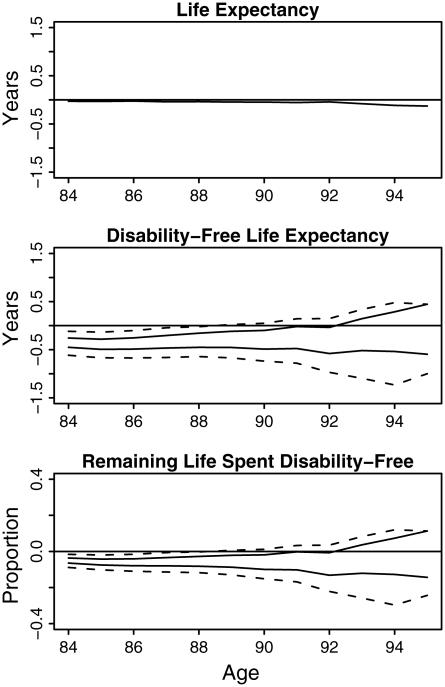
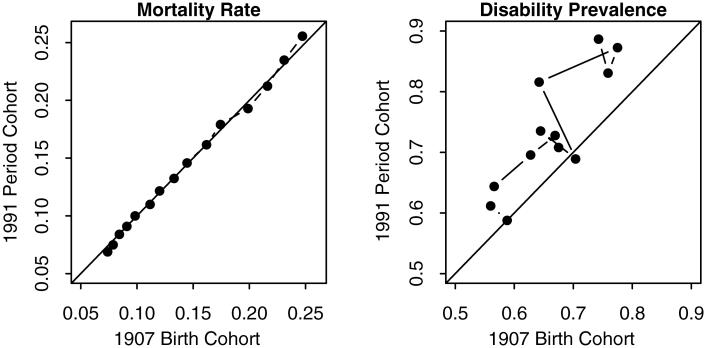
A rapidly aging population, such as the United States today, is characterized by the increased prevalence of chronic impairment. Robust estimation of disability-free life expectancy (DFLE), or healthy life expectancy, is essential for examining whether additional years of life are spent in good health and whether life expectancy is increasing faster than the decline of disability rates. Over 30 years since its publication, Sullivan's method remains the most widely used method to estimate DFLE. Therefore, it is surprising to note that Sullivan did not provide any formal justification of his method. Debates in the literature have centered around the properties of Sullivan's method and have yielded conflicting results regarding the assumptions required for Sullivan's method. In this article we establish a statistical foundation of Sullivan's method. We prove that, under stationarity assumptions, Sullivan's estimator is unbiased and consistent. This resolves the debate in the literature, which has generally concluded that additional assumptions are necessary. We also show that the standard variance estimator is consistent and approximately unbiased. Finally, we demonstrate that Sullivan's method can be extended to estimate DFLE without stationarity assumptions. Such an extension is possible whenever a cohort life table and either consecutive cross-sectional disability surveys or a longitudinal survey are available. Our empirical analysis of the 1907 and 1912 U.S. birth cohorts suggests that while mortality rates remain approximately stationary, disability rates decline during this time period.
Keywords: Aggregate data; Demography; Healthy life expectancy; Life tables; Morbidity; Mortality; Stationarity.
Figures
Similar articles
-
Obtaining multistate life table distributions for highly refined subpopulations from cross-sectional data: A Bayesian extension of Sullivan's method.Demography. 2010 Nov;47(4):1053-77. doi: 10.1007/BF03213739. Demography. 2010. PMID: 21308570 Free PMC article.
-
How good is Sullivan's method for monitoring changes in population health expectancies?J Epidemiol Community Health. 1997 Feb;51(1):80-6. doi: 10.1136/jech.51.1.80. J Epidemiol Community Health. 1997. PMID: 9135793 Free PMC article.
-
Regional patterns of disability-free life expectancy and disability-adjusted life expectancy: global Burden of Disease Study.Lancet. 1997 May 10;349(9062):1347-52. doi: 10.1016/S0140-6736(96)07494-6. Lancet. 1997. PMID: 9149696
-
Personalized predictive modeling for patients with Alzheimer's disease using an extension of Sullivan's life table model.Alzheimers Res Ther. 2017 Sep 20;9(1):75. doi: 10.1186/s13195-017-0302-6. Alzheimers Res Ther. 2017. PMID: 28931428 Free PMC article.
-
Sullivan's closet: a reappraisal of Harry Stack Sullivan's life and his pioneering role in American psychiatry.J Homosex. 1995;29(1):1-18. doi: 10.1300/J082v29n01_01. J Homosex. 1995. PMID: 7594406
Cited by
-
Disparities in Disability Life Expectancy in US Birth Cohorts: The Influence of Sex and Race.Soc Biol. 2006;53(3-4):152-171. doi: 10.1080/19485565.2006.9989124. Soc Biol. 2006. PMID: 26213420 Free PMC article.
-
The Length of Working Life in Spain: Levels, Recent Trends, and the Impact of the Financial Crisis.Eur J Popul. 2018 Jan 3;34(5):769-791. doi: 10.1007/s10680-017-9458-9. eCollection 2018 Dec. Eur J Popul. 2018. PMID: 30976261 Free PMC article.
-
Obtaining multistate life table distributions for highly refined subpopulations from cross-sectional data: A Bayesian extension of Sullivan's method.Demography. 2010 Nov;47(4):1053-77. doi: 10.1007/BF03213739. Demography. 2010. PMID: 21308570 Free PMC article.
-
Later-Life Living Arrangements of Americans With and Without Children: A Life Table Approach.J Gerontol B Psychol Sci Soc Sci. 2022 Jan 12;77(1):181-190. doi: 10.1093/geronb/gbab133. J Gerontol B Psychol Sci Soc Sci. 2022. PMID: 34260703 Free PMC article.
-
Mixed evidence for the compression of morbidity hypothesis for smoking elimination-a systematic literature review.Eur J Public Health. 2021 Apr 24;31(2):409-417. doi: 10.1093/eurpub/ckaa235. Eur J Public Health. 2021. PMID: 33338205 Free PMC article.
References
-
- Albarran I, Ayuso M, Guillen M, Monteverde M. A Multiple State Model for Disability Using the Decomposition of Death Probabilities and Cross-Sectional Data. Communications in Statistics, Part A—Theory and Methods. 2005;34:2063–2075.
-
- Arias E. United States Life Table, 2002. National Vital Statistics Reports. 2002;53:6. - PubMed
-
- Beran R. Balanced Simultaneous Confidence Sets. Journal of the American Statistical Association. 1988;83:679–686.
Publication types
Grants and funding
LinkOut - more resources
Full Text Sources