. 2015 Aug 20;524(7565):315-21.
doi: 10.1038/nature14886. Epub 2015 Aug 5.

Structural insights into µ-opioid receptor activation

Affiliations

Structural insights into µ-opioid receptor activation

Weijiao Huang et al. Nature. .

Erratum in

  • Author Correction: Structural insights into μ-opioid receptor activation.
    Huang W, Manglik A, Venkatakrishnan AJ, Laeremans T, Feinberg EN, Sanborn AL, Kato HE, Livingston KE, Thorsen TS, Kling RC, Granier S, Gmeiner P, Husbands SM, Traynor JR, Weis WI, Steyaert J, Dror RO, Kobilka BK. Huang W, et al. Nature. 2020 Aug;584(7820):E16. doi: 10.1038/s41586-020-2542-z. Nature. 2020. PMID: 32724208

Abstract

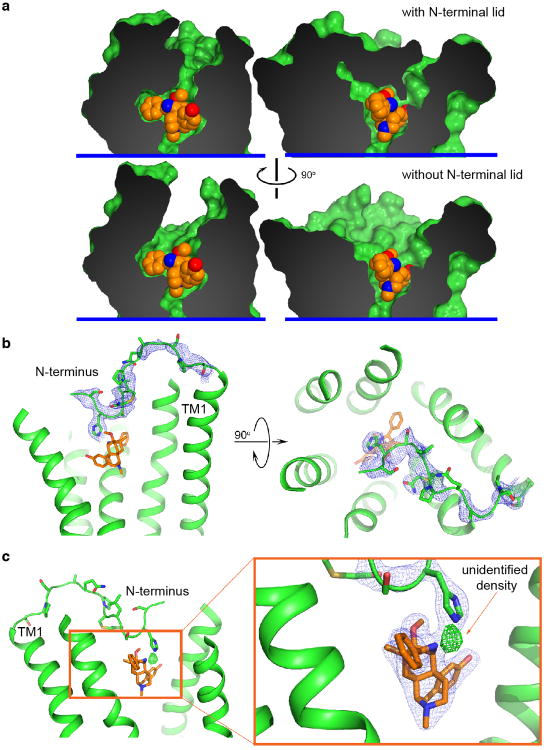
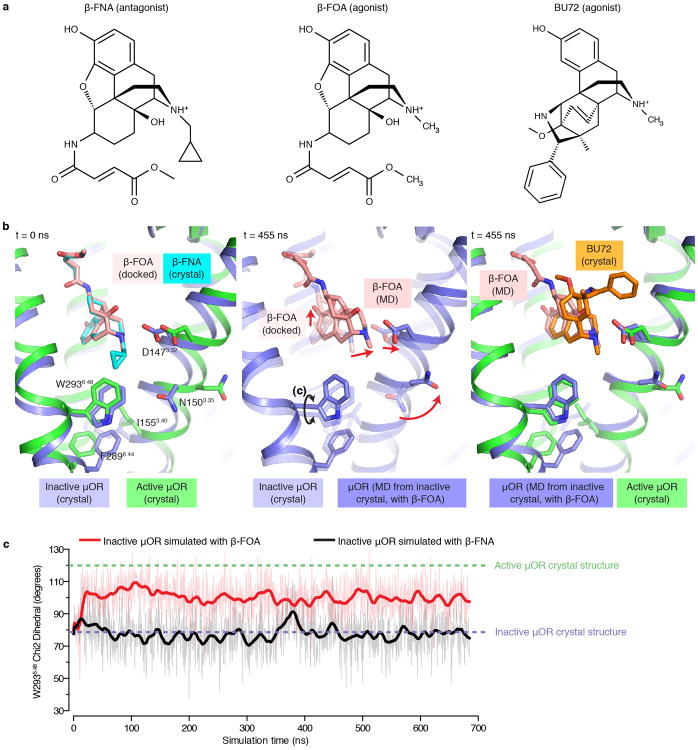
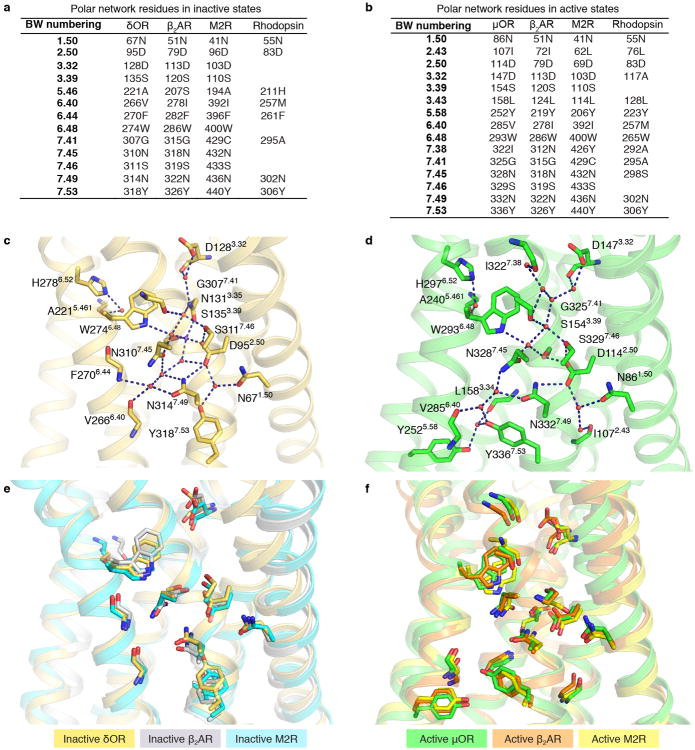
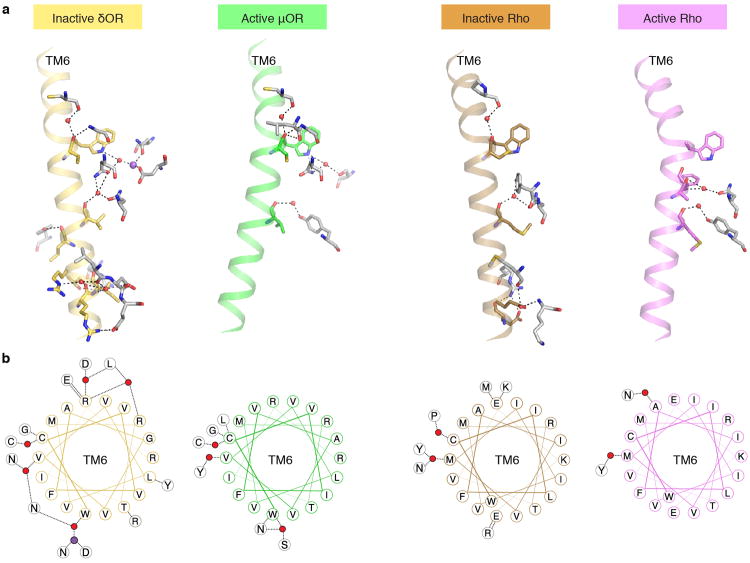
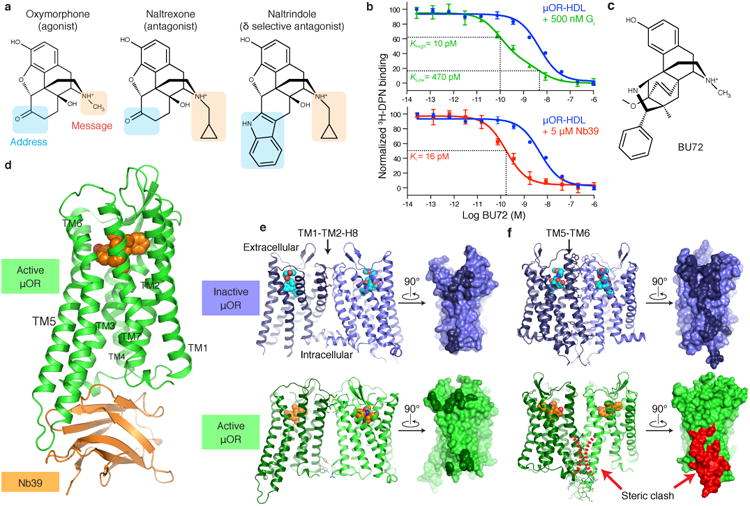
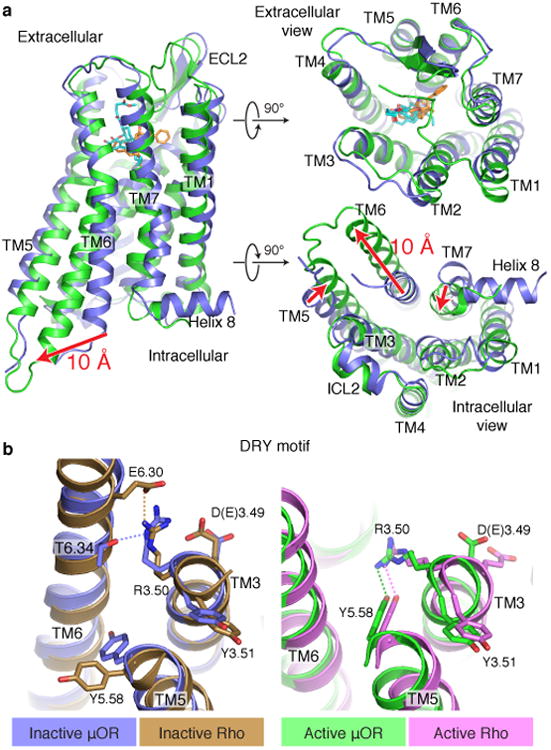
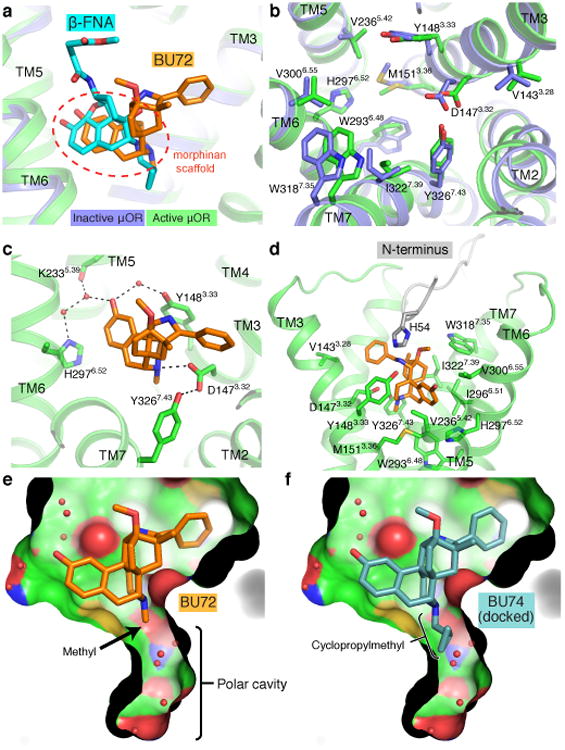
Activation of the μ-opioid receptor (μOR) is responsible for the efficacy of the most effective analgesics. To shed light on the structural basis for μOR activation, here we report a 2.1 Å X-ray crystal structure of the murine μOR bound to the morphinan agonist BU72 and a G protein mimetic camelid antibody fragment. The BU72-stabilized changes in the μOR binding pocket are subtle and differ from those observed for agonist-bound structures of the β2-adrenergic receptor (β2AR) and the M2 muscarinic receptor. Comparison with active β2AR reveals a common rearrangement in the packing of three conserved amino acids in the core of the μOR, and molecular dynamics simulations illustrate how the ligand-binding pocket is conformationally linked to this conserved triad. Additionally, an extensive polar network between the ligand-binding pocket and the cytoplasmic domains appears to play a similar role in signal propagation for all three G-protein-coupled receptors.


Figures

Extended Data Figure 1
Extended Data Figure 1. Characterization of Nb39 and lattice interactions in μOR-Nb39 crystals
a, 3H-diprenorphine (3H-DPN) competition binding shows increased affinity for μOR-selective agonists DAMGO and endomorphin-2 in the presence of Nb39. b, The dissociation half-life (t1/2) of BU72 was determined by measuring the association rate of the antagonist 3H-DPN in the presence of the indicated concentrations of BU72. The dissociation t1/2 of BU72 is 43 minutes and increases to 140 minutes in presence of Nb39. Panels a and b are representative of at least three experiments performed in triplicate, and the data and error bars represent the mean ± s.e.m. c, Crystal lattice packing of the μOR-Nb39 complex shows that most of the contacts are mediated by Nb39. The μOR extracellular domain is not involved in any contacts.
Extended Data Figure 2
Extended Data Figure 2. μOR-Nb39 interface
a, Nb39 does not penetrate as deeply into the core of the μOR when compared with the β2AR-Nb80 complex and the M2R-Nb9-8 complex. In the β2AR-Nb80 and M2R-Nb9-8 complexes, nanobody CDR3 residues bind within the core of the receptor transmembrane bundle. In comparison, Nb39 binding involves more framework residues. Notably, seven residues of CDR3 remained unresolved in the final model of the μOR-Nb39 complex. b, Nb39 interacts primarily through hydrogen bonds with residues from ICL2, ICL3 and Helix 8 of the μOR. c, Schematic representation of the interactions between μOR and Nb39 highlighting the numerous Nb39 framework interactions.
Extended Data Figure 3
Extended Data Figure 3. Cytoplasmic domain rearrangements in conserved regions
a, The E/DRY sequence is a highly conserved motif within Family A GPCRs responsible for constraining receptors in an inactive conformation. Comparisons of inactive and active state structures around the conserved E/DRY residues at the cytoplasmic surface of the μOR, the M2 muscarinic receptor (M2R), the β2 adrenergic receptor (β2AR) and Rhodopsin (Rho) are shown here. Hydrogen bonds are shown as dotted lines. b, The NPxxY motif is a highly conserved sequence in TM7 among Family A GPCRs. In the active state μOR, Y7.53 and N7.49 in TM7 interact with Y5.58 in TM5 and the backbone carbonyl of L3.43 in TM3 through a water mediated polar network. A similar network is observed in the active state of rhodopsin. While waters are not observed in the lower resolution structures of the β2AR and M2R, the positions of the side chains of Y7.53, N7.49 and Y5.58 suggest a similar water mediated network with putative waters represented by red circles.
Extended Data Figure 4
Extended Data Figure 4. Conformation of the binding pocket and BU72
The 2Fo-Fc electron density contoured at 2.0 σ and within 1.8 Å of residues comprising the active μOR ligand-binding pocket is shown as grey mesh in a and b. The same views are shown in c and d with the omit Fo-Fc density for BU72 displayed as an orange mesh. Displayed Fo-Fc electron density is contoured at 3.0 σ. e, Placement of an energetically minimized conformation of BU72 within the Fo-Fc electron density shows a poor fit for the pendant phenyl ring. The conformation of BU72 was minimized using quantum mechanical Hartree-Fock methods. f, An alternative possible ligand structure with sp2 geometry at the carbon adjacent to the phenyl (highlighted in red dashed circle) was initially considered due to a better fit within the electron density. This alternative ligand is predicted to be 2 daltons (Da) smaller than BU72. g, In order to resolve potential ambiguity in the cocrystallized ligand, we performed mass spectrometry on the same protein sample used to generate crystals of the active μOR. The protein was precipitated in methanol and the supernatant was subjected to MALDI-MS which revealed a strong peak at m/z=429.226, consistent with the expected mass of BU72. h, Shown is our final crystallographic model for BU72 within the Fo-Fc electron density. This model likely represents a high-energy conformation of BU72. Notably, the position of the morphinan scaffold is invariant between these alternative models for the crystallized ligand.
Extended Data Figure 5
Extended Data Figure 5. The N-terminus of the μOR interacts with BU72
a, Surface cut-away view showing that the N-terminus forms a lid over the ligand-binding pocket. Shown in the lower panel is the ligand-binding pocket in the absence of the N-terminus. b, Blue mesh shows the 2Fo-Fc omit map contoured at 1.0 σ for the N-terminus. c, Shown in green mesh is the Fo-Fc omit map contoured at 4.0 σ of an unidentified density between BU72 and H54.
Extended Data Figure 6
Extended Data Figure 6. Molecular dynamics simulation of active μOR bound to antagonist BU74
a, Structures of agonist BU72, and antagonists BU74 and β-funaltrexamine (β-FNA). The inactive state structure of μOR was co-crystallized with β-FNA. b, BU74 was docked into the active-state structure of the μOR based on the crystallographic pose of BU72, but in an MD simulation it rapidly moves away from this initial pose. The middle panel highlights the movements of BU74 after 560 nanoseconds (ns) of simulation and the rightmost panel shows the comparison of the BU74 pose as compared to the crystal structure of β-FNA bound to inactive μOR. c, Molecular dynamics trajectory measuring the distance between the phenolic hydroxyl of Y3267.43 and the tertiary amine of BU74. Dotted lines show the distance between Y3267.43 and the same amine of BU72 in the crystal structure of active μOR and β-FNA in the structure of inactive μOR.
Extended Data Figure 7
Extended Data Figure 7. Molecular dynamics simulation of inactive μOR bound to agonist β-FOA
a, Structures of agonists BU72 and β-fuoxymorphamine (β-FOA) and antagonist β-funaltrexamine (β-FNA). b, MD simulation of inactive μOR with β-FOA docked into the same pose as β-FNA in the inactive-state crystal structure of μOR. β-FOA shifts towards TM3 with an accompanying rearrangement of TM3 residues D1473.32 and N1503.35 towards the active-state structure. The overall ligand-binding pocket resembles the active state after 455 nanoseconds (ns) of simulation. c, Trajectory of the W2936.48 Chi2 dihedral angle (indicated in the middle panel in b) over 700 ns of simulation. In the presence of β-FOA, the preferred rotamer for W2936.48 rapidly approaches a conformation similar to the one observed in the structure of active μOR bound to BU72.
Extended Data Figure 8
Extended Data Figure 8. Comparison of polar networks involved in GPCR activation
a, Residues involved in the polar network in the inactive state of the δOR (PDB ID: 4N6H) and conservation of those residues in β2AR, M2R, and rhodopsin. b, Residues involved in the polar network in active state μOR and conservation in β2AR, M2R, and rhodopsin. c, Water-mediated polar network in the inactive structure of the δOR involves residues from TM1, TM2, TM3, TM5, TM6 and TM7. d, An identical view as in (c) of the polar network in the active μOR. e, Residues involved in the polar network in inactive structures of δOR, β2AR and M2R are conserved both in sequence and conformation. f, In active μOR, β2AR and M2R, the residues within the polar network are again conserved in sequence and conformation.
Extended Data Figure 9
Extended Data Figure 9. Differences in TM6 polar network in opioid receptors and rhodopsin
a, The entire set of contacts within the polar network that include a residue within TM6 is displayed for the inactive δOR, active μOR, and inactive and active rhodopsin (Rho). b, Helix wheel representation of TM6 showing polar contacts. Notably, the inactive δOR engages in many more polar contacts with neighboring residues as compared to inactive rhodopsin. Additionally, the active states of both μOR and rhodopsin have fewer polar contacts than the inactive state.
Figure 1
Figure 1. Activated structure of μOR bound to BU72 and Nb39
a, Structures of prototypical opioid ligands highlighting regions involved in encoding efficacy (message) and selectivity (address). b, 3H-diprenorphine (3H-DPN) radioligand competition binding of μOR in HDL particles. In the presence of Gi, the affinity of the morphinan agonist BU72 increases 47 fold. The two observed binding sites indicate the affinity of BU72 for receptor coupled to Gi and uncoupled to Gi. A similar 29-fold increase in affinity is observed in presence of Nb39. The binding curves are representative of at least three experiments performed in triplicate, and the data and error bars represent the mean ± s.e.m. c, Structure of the high affinity agonist BU72. d, Overall structure of the μOR-BU72-Nb39 complex. e, An interface between TM1-TM2 and H8 is observed in both inactive and active structures of the μOR. The residues comprising the interface are highlighted in dark colors on the surface view. f, The TM5-TM6 interface observed for inactive μOR is not compatible with the active state due to clashing residues in TM5 and TM6 (highlighted in red).
Figure 2
Figure 2. Structural comparison of inactive and active μOR
a, Active μOR undergoes a 10 Å outward displacement of TM6 on activation. The extracellular domain of the receptor shows minimal changes upon activation. b, Comparison of the conserved E/DRY motif in the inactive structures of μOR (blue) and rhodopsin (Rho, brown) shows a polar interaction between R3.50 and T6.34 in μOR, analogous to the ionic lock between R3.50 and E6.30 observed for rhodopsin. c, Comparison of the same region in the active state of μOR (green) and Rho (purple) shows a conserved interaction between R3.50 and Y5.58.
Figure 3
Figure 3. μOR agonist binding pocket
a, BU72 and β-funaltrexamine (β-FNA) occupy a similar pose in the μOR binding pocket. The common morphinan scaffold shared by both ligands is highlighted. b, Binding pocket residues of inactive (blue) and active (green) μOR viewed from the extracellular side. c, Polar interactions between BU72 and active μOR. d, BU72 and binding pocket residues shown with the proximal amino-terminus (grey). e, View of the polar cavity extending towards the intracellular side of μOR in the active state. f, The cyclopropylmethyl group of the antagonist BU74 can be docked to fit within the polar cavity of the active state. However, MD simulations show that this pose is unstable (Extended Data Figure 6).
Figure 4
Figure 4. Mechanisms of allosteric coupling in μOR
a, Comparison of the structural rearrangements in the conserved core triad of μOR, β2AR, and M2R. b, The morphinan ligands BU72 and β-FNA bind to the μOR with a shared hydrophobic surface shown in spheres. BU72 binding results in a 1.5 Å displacement of TM3 towards TM2 and a rotameric change in the sodium coordinating residue N1503.35. Red arrows highlight displacement of the ligand or TM3 upon activation. c, In an MD simulation initiated from the active μOR structure but with the agonist BU72 removed from the binding site, residues in TM3, including the conserved core triad residue I1553.40, adopt an inactive-like conformation. The motions of I1553.40 and ligand-contacting residue D1473.32 are tightly coupled throughout the simulation. Atom positions during simulation are plotted relative to the active structure, with positive values representing displacement toward the position in the inactive structure (see Full Methods). Dashed horizontal lines represent the positions of the indicated atoms in the inactive structure. d, W2936.48 is slightly closer to the phenolic aromatic of the morphinan in the active state of μOR. e, MD simulations show that removal of the agonist BU72 from the active structure results in a change in the preferred rotamer of W2936.48. MD results were consistent across multiple simulations; see Supplementary Section.
Figure 5
Figure 5. Rearrangement of a conserved polar network
a, b Comparison of the water-mediated polar network in the active μOR and high-resolution inactive δOR (PDB ID: 4N6H). To simplify comparisons between different receptors, only Ballesteros-Weinstein numbers are used to label amino acid side chains. The network extends from the orthosteric ligand-binding site to the G protein-coupling domain of the receptor. c, The active structure of μOR reveals the basis for sodium ion allosteric regulation of GPCR function. Rearrangement of S3.39 and N3.35 eliminates the sodium ion coordination site in the active state. d, Conserved hydrogen bonding network in the NPxxY region between active μOR and rhodopsin.

Similar articles

Cited by

References

    1. Matthes HW, et al. Loss of morphine-induced analgesia, reward effect and withdrawal symptoms in mice lacking the μ-opioid-receptor gene. 1996 - PubMed
    1. Brownstein MJ. A brief history of opiates, opioid peptides, and opioid receptors. Proceedings of the National Academy of Sciences of the United States of America. 1993;90:5391–5393. - PMC - PubMed
    1. Schumacher MA, Basbaum AI, Naidu RK. In: Basic & Clinical Pharmacology, 13e. Katzung Bertram G, Trevor Anthony J., editors. McGraw-Hill Medical; 2015.
    1. Raehal KM, Walker JK, Bohn LM. Morphine side effects in β-arrestin 2 knockout mice. Journal of Pharmacology and Experimental Therapeutics. 2005;314:1195–1201. - PubMed
    1. Bohn LM, Gainetdinov RR, Lin FT, Lefkowitz RJ, Caron MG. [mu]-Opioid receptor desensitization by [beta]-arrestin-2 determines morphine tolerance but not dependence. Nature. 2000;408:720–723. - PubMed

Publication types

MeSH terms

Associated data