Global, Regional, and National Consumption of Sugar-Sweetened Beverages, Fruit Juices, and Milk: A Systematic Assessment of Beverage Intake in 187 Countries
- PMID: 26244332
- PMCID: PMC4526649
- DOI: 10.1371/journal.pone.0124845
Global, Regional, and National Consumption of Sugar-Sweetened Beverages, Fruit Juices, and Milk: A Systematic Assessment of Beverage Intake in 187 Countries
Erratum in
-
Correction: Global, Regional, and National Consumption of Sugar-Sweetened Beverages, Fruit Juices, and Milk: A Systematic Assessment of Beverage Intake in 187 Countries.PLoS One. 2019 Mar 27;14(3):e0214344. doi: 10.1371/journal.pone.0214344. eCollection 2019. PLoS One. 2019. PMID: 30917182 Free PMC article.
Abstract
Background: Sugar-sweetened beverages (SSBs), fruit juice, and milk are components of diet of major public health interest. To-date, assessment of their global distributions and health impacts has been limited by insufficient comparable and reliable data by country, age, and sex.
Objective: To quantify global, regional, and national levels of SSB, fruit juice, and milk intake by age and sex in adults over age 20 in 2010.
Methods: We identified, obtained, and assessed data on intakes of these beverages in adults, by age and sex, from 193 nationally- or subnationally-representative diet surveys worldwide, representing over half the world's population. We also extracted data relevant to milk, fruit juice, and SSB availability for 187 countries from annual food balance information collected by the United Nations Food and Agriculture Organization. We developed a hierarchical Bayesian model to account for measurement incomparability, study representativeness, and sampling and modeling uncertainty, and to combine and harmonize nationally representative dietary survey data and food availability data.
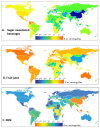
Results: In 2010, global average intakes were 0.58 (95%UI: 0.37, 0.89) 8 oz servings/day for SSBs, 0.16 (0.10, 0.26) for fruit juice, and 0.57 (0.39, 0.83) for milk. There was significant heterogeneity in consumption of each beverage by region and age. Intakes of SSB were highest in the Caribbean (1.9 servings/day; 1.2, 3.0); fruit juice consumption was highest in Australia and New Zealand (0.66; 0.35, 1.13); and milk intake was highest in Central Latin America and parts of Europe (1.06; 0.68, 1.59). Intakes of all three beverages were lowest in East Asia and Oceania. Globally and within regions, SSB consumption was highest in younger adults; fruit juice consumption showed little relation with age; and milk intakes were highest in older adults.
Conclusions: Our analysis highlights the enormous spectrum of beverage intakes worldwide, by country, age, and sex. These data are valuable for highlighting gaps in dietary surveillance, determining the impacts of these beverages on global health, and targeting dietary policy.
Conflict of interest statement
Figures


Similar articles
-
Beverage intake among preschool children and its effect on weight status.Pediatrics. 2006 Oct;118(4):e1010-8. doi: 10.1542/peds.2005-2348. Pediatrics. 2006. PMID: 17015497
-
Changing beverage consumption patterns have resulted in fewer liquid calories in the diets of US children: National Health and Nutrition Examination Survey 2001-2010.J Acad Nutr Diet. 2015 Apr;115(4):559-66.e4. doi: 10.1016/j.jand.2014.09.004. Epub 2014 Nov 7. J Acad Nutr Diet. 2015. PMID: 25441966
-
Beverage Consumption and Growth, Size, Body Composition, and Risk of Overweight and Obesity: A Systematic Review [Internet].Alexandria (VA): USDA Nutrition Evidence Systematic Review; 2020 Jul. Alexandria (VA): USDA Nutrition Evidence Systematic Review; 2020 Jul. PMID: 35349233 Free Books & Documents. Review.
-
Changes in prices, sales, consumer spending, and beverage consumption one year after a tax on sugar-sweetened beverages in Berkeley, California, US: A before-and-after study.PLoS Med. 2017 Apr 18;14(4):e1002283. doi: 10.1371/journal.pmed.1002283. eCollection 2017 Apr. PLoS Med. 2017. PMID: 28419108 Free PMC article.
-
Beverage Consumption During Pregnancy and Birth Weight: A Systematic Review [Internet].Alexandria (VA): USDA Nutrition Evidence Systematic Review; 2020 Jul. Alexandria (VA): USDA Nutrition Evidence Systematic Review; 2020 Jul. PMID: 35349234 Free Books & Documents. Review.
Cited by
-
The Consumption of Non-Sugar Sweetened and Ready-to-Drink Beverages as Emerging Types of Beverages in Shanghai.Nutrients. 2024 Oct 19;16(20):3547. doi: 10.3390/nu16203547. Nutrients. 2024. PMID: 39458541 Free PMC article.
-
Exploring Sugary Drink Consumption and Perceptions among Primary-School-Aged Children and Parents in Australia.Nutrients. 2024 Sep 30;16(19):3320. doi: 10.3390/nu16193320. Nutrients. 2024. PMID: 39408287 Free PMC article.
-
Carbonated Beverage, Fruit Drink, and Water Consumption and Risk of Acute Stroke: the INTERSTROKE Case-Control Study.J Stroke. 2024 Sep;26(3):391-402. doi: 10.5853/jos.2024.01543. Epub 2024 Sep 27. J Stroke. 2024. PMID: 39326863 Free PMC article.
-
Adaptation and Validation of a Modified Broth Microdilution Method for Screening the Anti-Yeast Activity of Plant Phenolics in Apple and Orange Juice Models.Life (Basel). 2024 Jul 26;14(8):938. doi: 10.3390/life14080938. Life (Basel). 2024. PMID: 39202680 Free PMC article.
-
Association of Beverage Consumption during Pregnancy with Adverse Maternal and Offspring Outcomes.Nutrients. 2024 Jul 25;16(15):2412. doi: 10.3390/nu16152412. Nutrients. 2024. PMID: 39125293 Free PMC article.
References
Publication types
MeSH terms
Substances
Grants and funding
LinkOut - more resources
Full Text Sources
Other Literature Sources
Medical

