. 2015 Aug 13;162(4):823-35.
doi: 10.1016/j.cell.2015.07.010. Epub 2015 Jul 30.

Circadian Rhythms in Rho1 Activity Regulate Neuronal Plasticity and Network Hierarchy

Affiliations

Circadian Rhythms in Rho1 Activity Regulate Neuronal Plasticity and Network Hierarchy

Afroditi Petsakou et al. Cell. .

Abstract

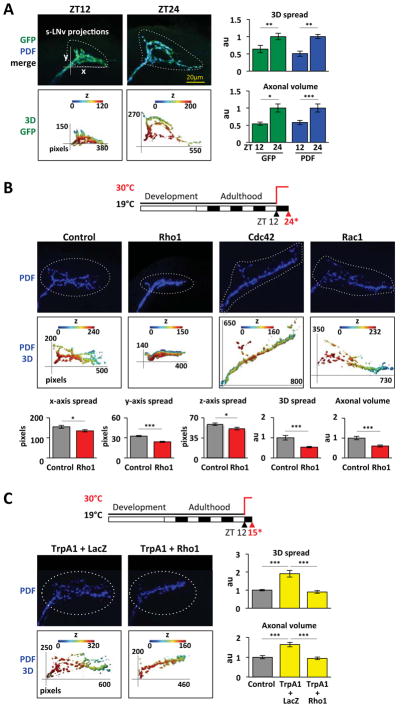
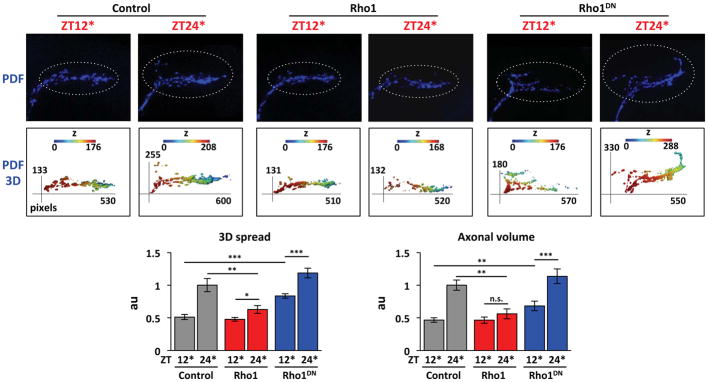
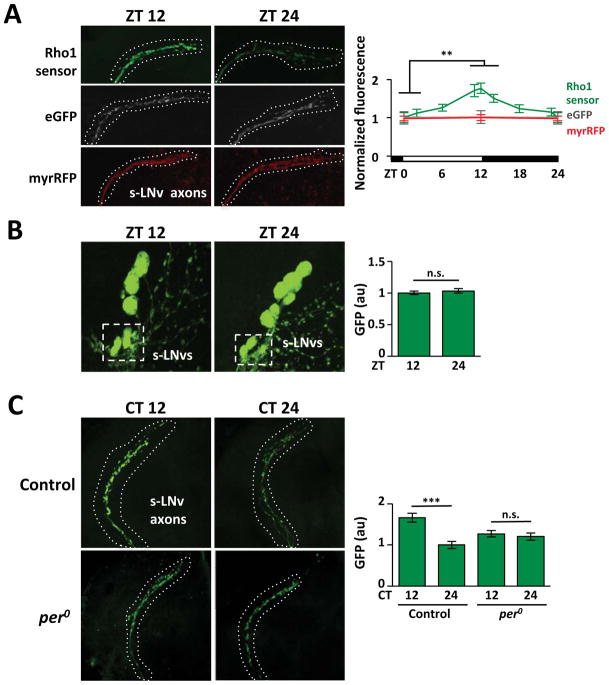
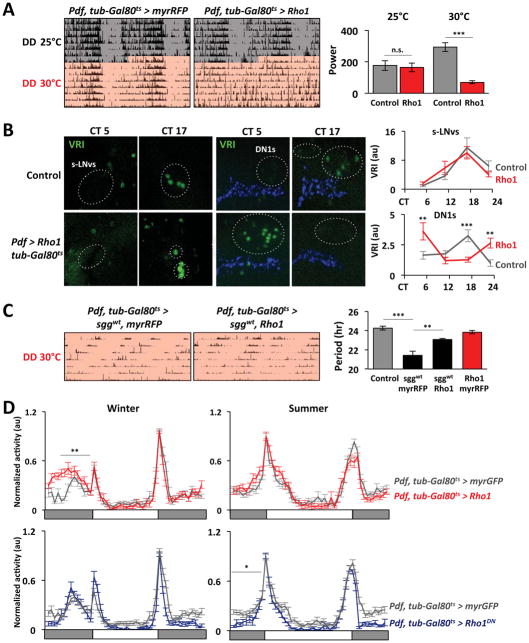
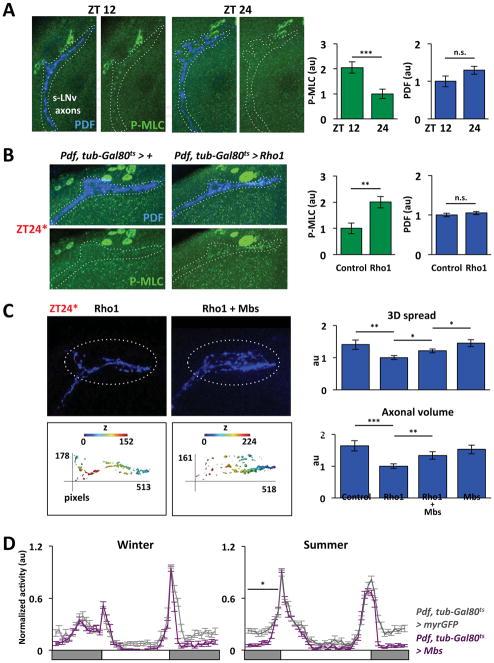
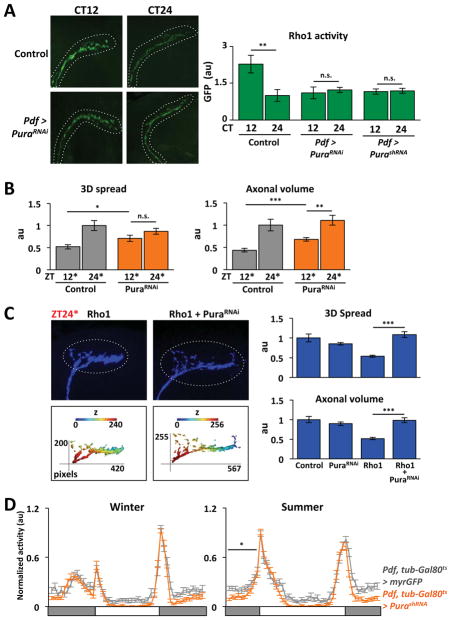
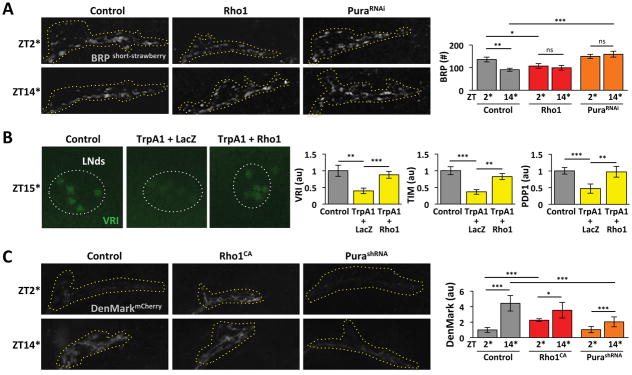
Neuronal plasticity helps animals learn from their environment. However, it is challenging to link specific changes in defined neurons to altered behavior. Here, we focus on circadian rhythms in the structure of the principal s-LNv clock neurons in Drosophila. By quantifying neuronal architecture, we observed that s-LNv structural plasticity changes the amount of axonal material in addition to cycles of fasciculation and defasciculation. We found that this is controlled by rhythmic Rho1 activity that retracts s-LNv axonal termini by increasing myosin phosphorylation and simultaneously changes the balance of pre-synaptic and dendritic markers. This plasticity is required to change clock network hierarchy and allow seasonal adaptation. Rhythms in Rho1 activity are controlled by clock-regulated transcription of Puratrophin-1-like (Pura), a Rho1 GEF. Since spinocerebellar ataxia is associated with mutations in human Puratrophin-1, our data support the idea that defective actin-related plasticity underlies this ataxia.


Figures

Figure 1
Figure 1. Rho1 prevents s-LNv projections from expanding
A. Confocal images of s-LNv projections from Pdf > CD8::GFP flies stained with antibodies to GFP (green) and PDF (blue) at ZT12 and ZT24. 3D reconstructions (rainbow images) were generated using the Matlab script (see Experimental procedures) with colors indicating depth in the z-axis (blue to red represents dorsal to ventral). White dots show the area quantified. 1pixel = 0.12μm and z-step is 1μm. Graphs on right quantify 3D spread and axonal volume using the Matlab script. B. Top: Induction of Rho GTPase transgenes. Flies were raised at 19°C and entrained in LD cycles at 19°C for at least 3 days before shifting to 30°C at ZT12. Flies were dissected 12hr later (ZT24*) and stained with anti-PDF. Confocal images of s-LNv projections and their 3D reconstructions as above at ZT24* for Control (Pdf, tub-Gal80ts > CD8::GFP), Rho1 (Pdf, tub-Gal80ts > Rho1), Cdc42 (Pdf, tub-Gal80ts > Cdc42CA) and Rac1 (Pdf, tub-Gal80ts > Rac1). Graphs quantify parameters of s-LNv projections from Control and Rho1-induced flies. C. Top: Diagram of induction. Flies were handled and stained as in Figure 1B except dissection was at ZT15*. Confocal images and 3D reconstructions as above for TrpA1 + LacZ (Pdf, tub-Gal80ts > TrpA1, LacZ) and TrpA1 + Rho1 (Pdf, tub-Gal80ts > TrpA1, Rho1). Control flies were Pdf, tub-Gal80ts > myrRFP. Graphs quantify s-LNv projections. Error bars show SEM. Statistical comparisons are with Student’s t-test. *p<0.05, **p<0.01, ***p<0.001. Significance was also verified with ANOVA. (See also Figure S1)
Figure 2
Figure 2. Inducing Rho1 locks s-LNv projections in a dusk-like state
Flies were raised and entrained as in Figure 1B. Rho1 was induced starting either at dawn with brains fixed at ZT12* or starting at dusk with brains fixed at ZT24*. Confocal images of s-LNv projections and their 3D reconstructions as in Figure 1 from Control (Pdf, tub-Gal80ts > myrGFP + myrRFP), Rho1 (Pdf, tub-Gal80ts > Rho1 + myrRFP) and Rho1DN (Pdf, tub-Gal80ts > Rho1DN) flies. s-LNv projections were stained with anti-PDF and quantified as in Figure 1B. 1 pixel = 0.12μm and z-step is 1μm. Statistical comparisons are with Student’s t-test. *p<0.05, **p<0.01, ***p<0.001, n.s.: non-significant. Significance was also verified with ANOVA. (See also Figure S2)
Figure 3
Figure 3. Circadian oscillations in Rho1 activity in s-LNv axons
A. Confocal images of s-LNv axons from flies expressing Rho1-activity sensor (Pdf > PKNG58AeGFP, green), eGFP (Pdf > eGFP, grey) or myrRFP (Pdf > myrRFP, red) stained with anti-GFP or anti-RFP. Graph shows average fluorescence levels in LD measured with Fiji with ZT0 data replotted at ZT24. B. Confocal images of s-LNv cell bodies from flies expressing Rho1-activity sensor with average GFP levels plotted on the right. C. Confocal images of s-LNv axons and termini from control (Pdf > PKNG58AeGFP) and per0 flies (per0; Pdf > PKNG58AeGFP) with average GFP levels plotted on the right. Error bars show SEM. Statistical comparisons are with Student’s t-test. **p<0.01, ***p<0.001, n.s.: non-significant.
Figure 4
Figure 4. Rho1 regulates an output pathway important for circadian behavior and seasonal adaptation
A. Left: Actograms show locomotor activity in DD of Control (Pdf, tub-Gal80ts > myrRFP) and Rho1-inducible flies (Pdf, tub-Gal80ts > Rho1) for 7 days at 25°C (grey) or 30°C (pink). Right: Average rhythm power at 25°C and at 30°C in DD (also see Table S1). B. Flies were entrained to LD cycles at 19°C and then transferred to DD at 30°C. Confocal images of s-LNv cell bodies (left panels) and DN1 clock neurons (right panels) from Control (Pdf, tub-Gal80ts > +) and Rho1-induced flies (Pdf, tub-Gal80ts > Rho1) stained with antibodies to VRI (green) and PDF (blue) at CT5 and CT17 on day 3 in DD. Graphs show average VRI fluorescence. The phase of the oscillation in DN1s was significantly different between genotypes (p<0.01, ANOVA). C. Left: Actograms of Pdf, tub-Gal80ts > sggwt,myrRFP and Pdf, tub-Gal80ts > sggwt,Rho1 flies at 30°C in DD. Right: Graph shows average period of rhythmic flies (also see Table S1). D. Locomotor activity of Control (Pdf, tub-Gal80ts > myrGFP, grey), Rho1- (Pdf, tub-Gal80ts > Rho1, red) and Rho1DN-induced flies (Pdf, tub-Gal80ts > Rho1DN, blue) in winter (10L:14D) or summer (14L:10D) light conditions. Error bars show SEM. Statistical comparisons are with Student’s t-test (A–C) and ANOVA (D). *p<0.05, **p<0.01, ***p<0.001, n.s.: non-significant. (See also Figure S3)
Figure 5
Figure 5. Rho1 controls rhythmic myosin light chain phosphorylation in s-LNv axons
A. Confocal images of s-LNv axons at ZT12 and ZT24 stained with antibodies against P-MLC (green) and PDF (blue). Fluorescent intensity was measured with Fiji and the normalized average plotted on the right. B. Confocal images of s-LNv axons at ZT24* from Pdf, tub-Gal80ts > + and Pdf, tub-Gal80ts > Rho1 flies stained and analyzed as in A. C. Confocal images of s-LNv projections stained with anti-PDF (blue) and their 3D reconstructions as in Figure 1 from flies with Rho1-induced (Rho1) or both Rho1 and Mbs-induced (Rho1 + Mbs). Graphs show average 3D spread and axonal volume for Control (Pdf, tub-Gal80ts > myrRFP + myrGFP), Rho1 (Pdf, tub-Gal80ts > Rho1 + myrRFP), Rho1 + Mbs (Pdf, tub-Gal80ts > Rho1 + Mbs) and Mbs (Pdf, tub-Gal80ts > Mbs + myrRFP) induced flies. 1pixel = 0.12μm and z-step is 1μm. D. Locomotor activity of Control (Pdf, tub-Gal80ts > myrGFP, grey) and Mbs-induced (Pdf, tub-Gal80ts > Mbs, purple) flies as in Figure 4D. Error bars show SEM. Statistical comparisons are with Student’s t-test (A–C) and ANOVA (D). *p<0.05, **p<0.01, ***p<0.001, n.s.: non-significant. (See also Figure S4 and Table S1)
Figure 6
Figure 6. Pura is a clock-regulated Rho1 GEF that activates Rho1 in s-LNv axons at dusk and is required for seasonal adaptation
A. Confocal images of s-LNv axons at CT12 and CT24 on day 1 in DD from Control (Pdf > PKNG58AeGFP + corazoninRNAi) and Pdf > PuraRNAi flies (Pdf > PKNG58AeGFP + PuraRNAi) expressing the Rho1-activity sensor (green) as in Figure 3. Graph shows the average fluorescence intensity of the Rho1-sensor in s-LNv axons from the above genotypes and from Pdf > PurashRNA flies (Pdf > PKNG58AeGFP + PurashRNA). B. s-LNv projections were stained with anti-PDF and quantified as in Figure 1 from Control (Pdf, tub-Gal80ts > myrRFP) and PuraRNAi flies (Pdf, tub-Gal80ts > PuraRNAi) and entrained and shifted to 30°C for 12hr as in Figure 2. C. Confocal images of s-LNv projections stained with PDF (blue) and their 3D reconstructions from flies with either Rho1 (Pdf, tub-Gal80ts > Rho1 + myrRFP) or Rho1 and PuraRNAi (Pdf, tub-Gal80ts > Rho1 + PuraRNAi) induced for 12hr and fixed at ZT24*. Graphs show the average 3D spread and axonal volume. 1pixel = 0.12μm and z-step is 1μm. D. Locomotor activity of Control (Pdf, tub-Gal80ts > myrGFP, grey) and PurashRNA-induced flies (Pdf, tub-Gal80ts > PurashRNA, orange) as in Figure 4D. Error bars show SEM. Statistical comparisons are with Student’s t-test (A–C) and ANOVA (D). *p<0.05, **p<0.01, ***p<0.001, n.s.: non-significant. (See also Figure S5 and Table S1)
Figure 7
Figure 7. Pura and Rho1 regulate synaptic plasticity
A. Confocal images of s-LNv projections at ZT2* and ZT14* from Control (Pdf, tub-Gal80ts > brpshort-strawberry + LacZ), Rho1 (Pdf, tub-Gal80ts > brpshort-strawberry + Rho1) and PuraRNAi (Pdf, tub-Gal80ts > brpshort-strawberry + PuraRNAi) flies. Flies were raised at 19°C and entrained in LD cycles at 19°C for at least 3 days before shifting to 30°C, starting at ZT12 or ZT24. Flies were dissected 14hr later at ZT2* and ZT14* respectively and brains stained with αDsRed (grey) to visualize Brp. Graph shows average numbers of active zones. B. Confocal images of LNd clock neurons from Control (Pdf, tub-Gal80ts > myrRFP), TrpA1 + LacZ (Pdf, tub-Gal80ts > TrpA1, LacZ) and TrpA1 + Rho1 (Pdf, tub-Gal80ts > TrpA1, Rho1) flies. Flies were raised and entrained in LD at 19°C before shifting to 30°C for 3hr at ZT12 and dissecting 3hr later at ZT15*. Brains were stained for VRI (green), TIM and PDP1. Quantification was as in Figure 4B. C. Confocal images of s-LNv projections at ZT2* (top) and ZT14* (bottom) from Control (Pdf, tub-Gal80ts > DenMarK + LacZ), Rho1 (Pdf, tub-Gal80ts > DenMarK + Rho1CA) and PurashRNA (Pdf, tub-Gal80ts > DenMarK + PurashRNA) flies. Flies were handled as in 7A and brains stained with αDsRed (grey). Quantification of average DenMark fluorescence levels was performed with Fiji. Error bars show SEM. Statistical comparisons are with Student’s t-test. *p<0.05, **p<0.01, ***p<0.001, n.s.: non-significant. (See also Figure S6)

Comment in

Similar articles

Cited by

References

    1. Amino T, Ishikawa K, Toru S, Ishiguro T, Sato N, Tsunemi T, Murata M, Kobayashi K, Inazawa J, Toda T, et al. Redefining the disease locus of 16q22.1-linked autosomal dominant cerebellar ataxia. J Hum Genet. 2007;52:643–649. - PubMed
    1. Becquet D, Girardet C, Guillaumond F, Francois-Bellan AM, Bosler O. Ultrastructural plasticity in the rat suprachiasmatic nucleus. Possible involvement in clock entrainment. Glia. 2008;56:294–305. - PubMed
    1. Billuart P, Winter CG, Maresh A, Zhao X, Luo L. Regulating axon branch stability: the role of p190 RhoGAP in repressing a retraction signaling pathway. Cell. 2001;107:195–207. - PubMed
    1. Cao G, Nitabach MN. Circadian control of membrane excitability in Drosophila melanogaster lateral ventral clock neurons. J Neurosci. 2008;28:6493–6501. - PMC - PubMed
    1. Cao G, Platisa J, Pieribone VA, Raccuglia D, Kunst M, Nitabach MN. Genetically targeted optical electrophysiology in intact neural circuits. Cell. 2013;154:904–913. - PMC - PubMed

Publication types

LinkOut - more resources