. 2015 Aug 18;43(2):289-303.
doi: 10.1016/j.immuni.2015.06.014. Epub 2015 Jul 28.

MyD88 Adaptor-Dependent Microbial Sensing by Regulatory T Cells Promotes Mucosal Tolerance and Enforces Commensalism

Affiliations

MyD88 Adaptor-Dependent Microbial Sensing by Regulatory T Cells Promotes Mucosal Tolerance and Enforces Commensalism

Sen Wang et al. Immunity. .

Abstract

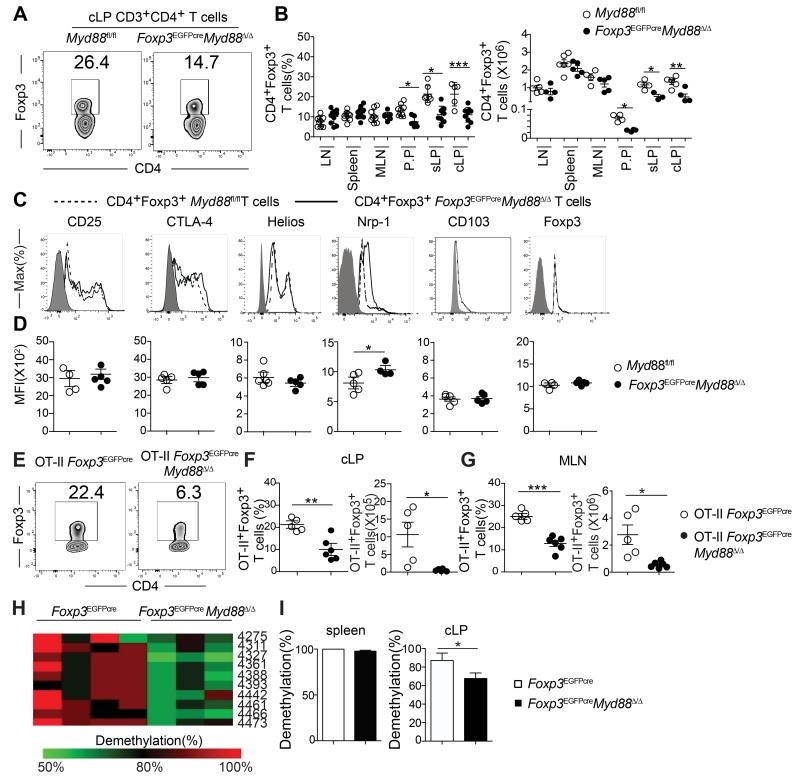
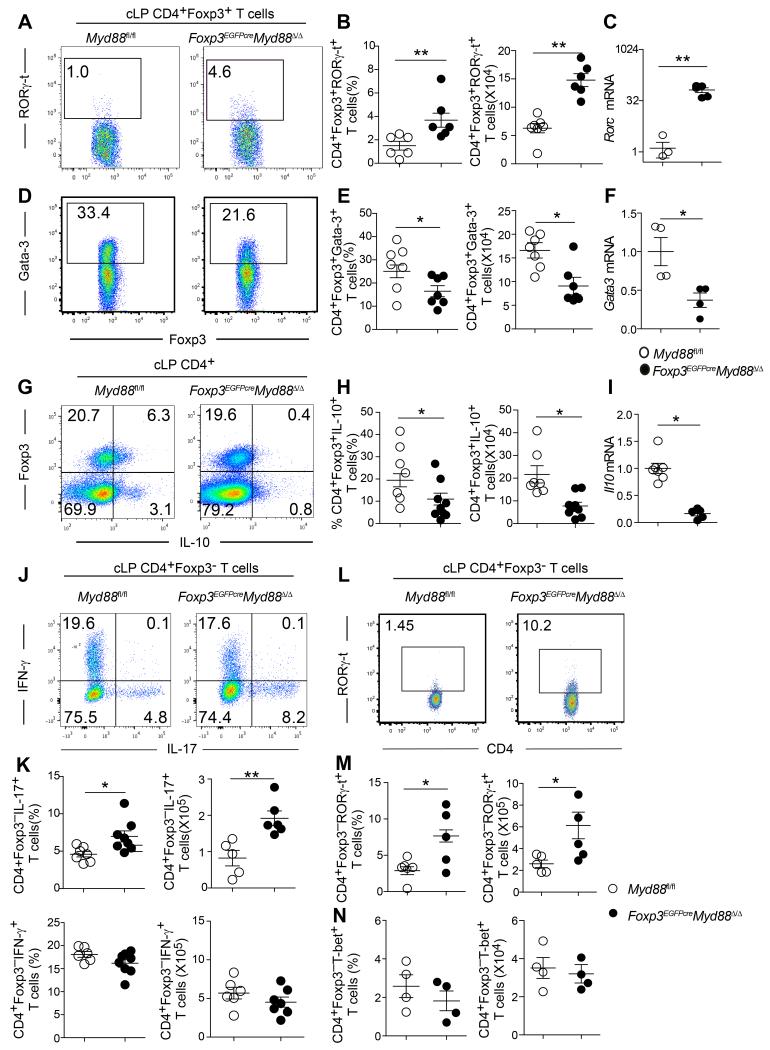
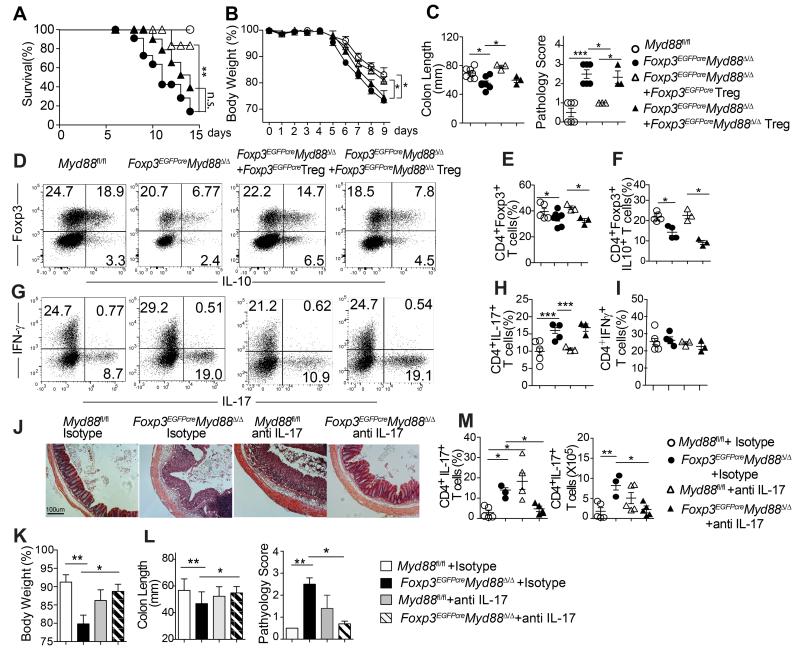
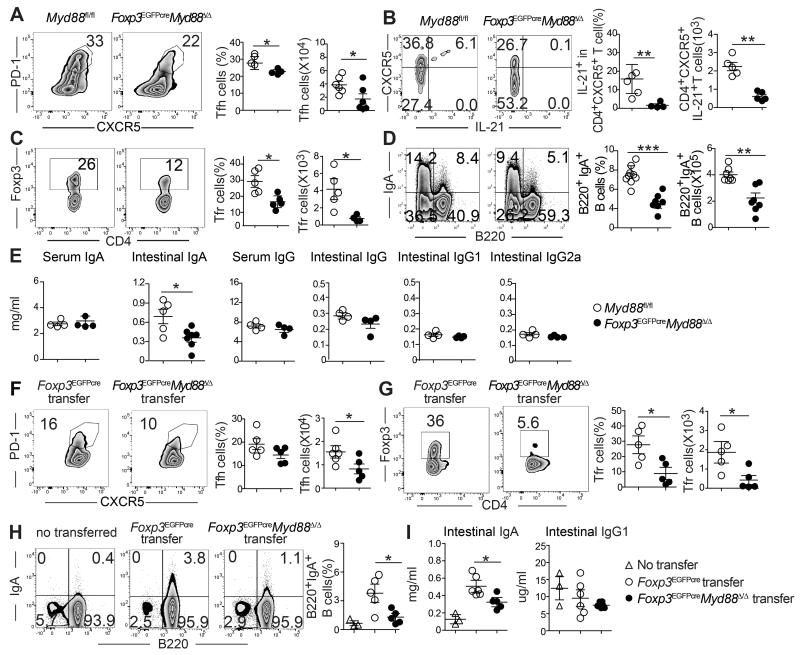
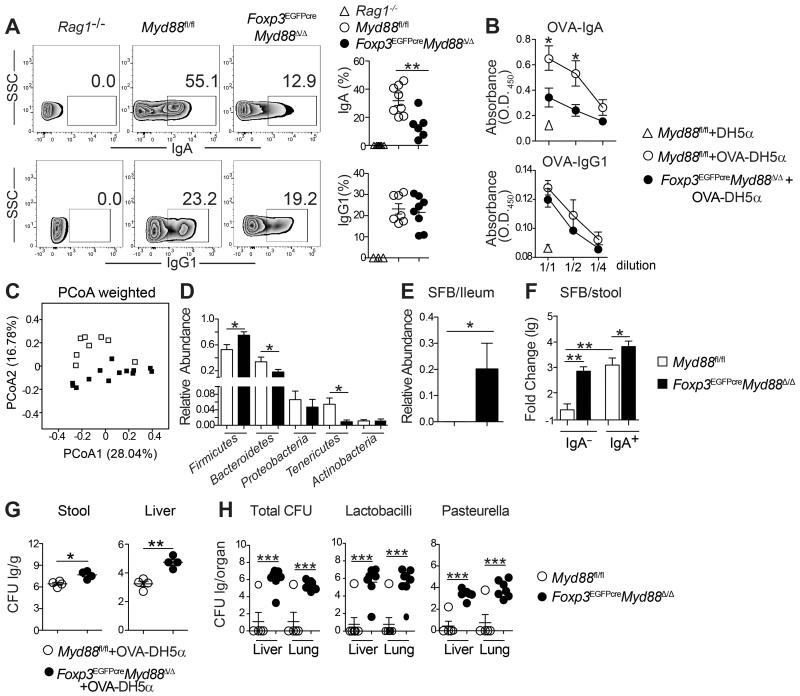
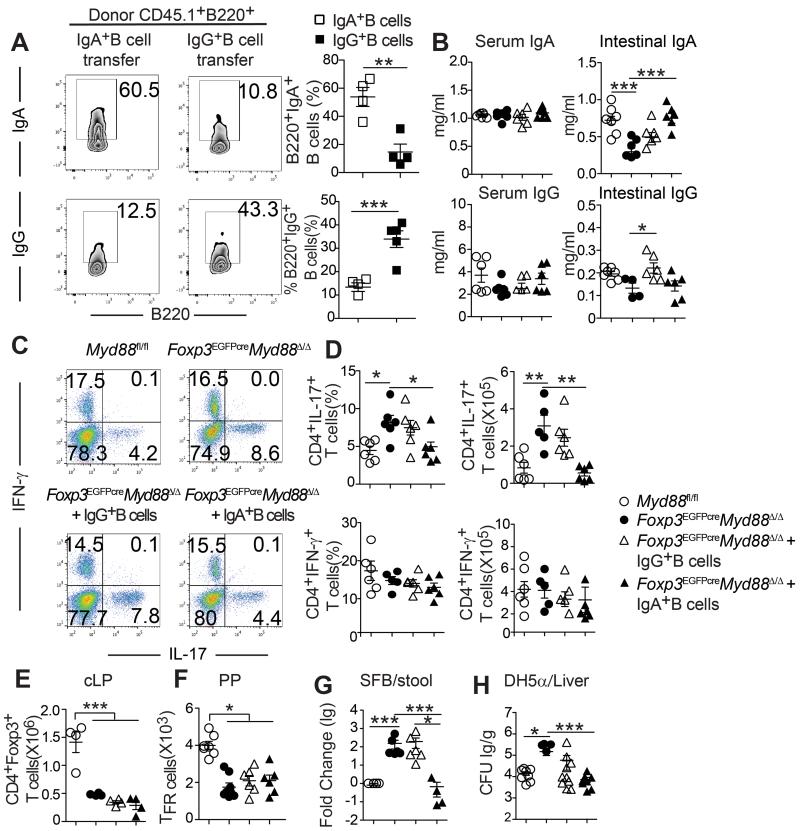
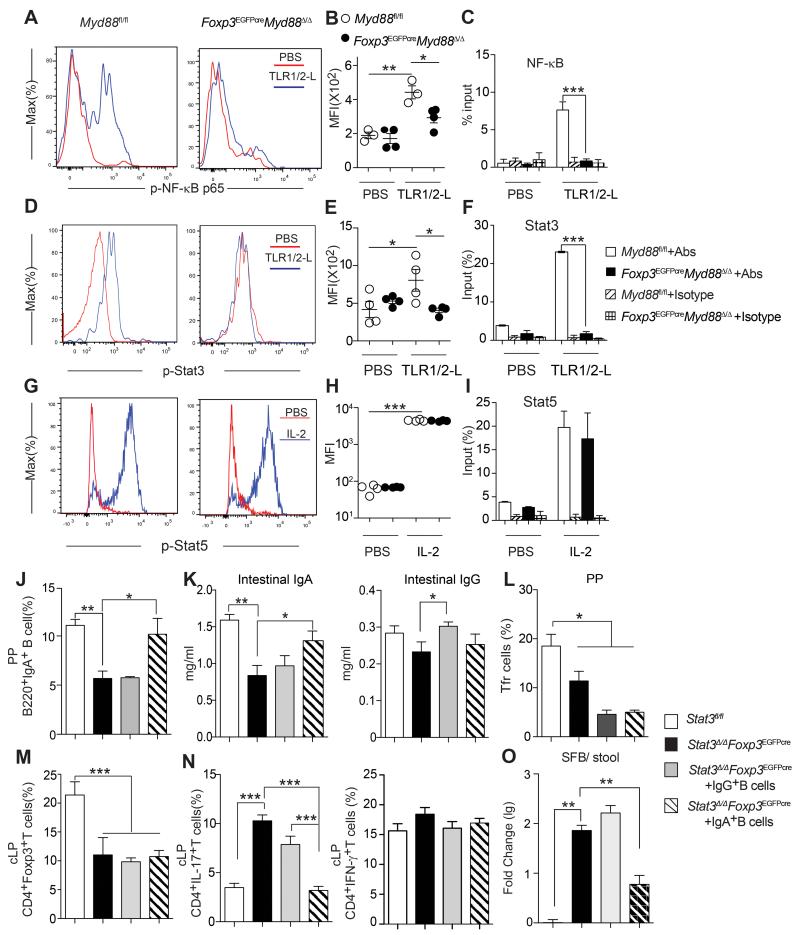
Commensal microbiota promote mucosal tolerance in part by engaging regulatory T (Treg) cells via Toll-like receptors (TLRs). We report that Treg-cell-specific deletion of the TLR adaptor MyD88 resulted in deficiency of intestinal Treg cells, a reciprocal increase in T helper 17 (Th17) cells and heightened interleukin-17 (IL-17)-dependent inflammation in experimental colitis. It also precipitated dysbiosis with overgrowth of segmented filamentous bacteria (SFB) and increased microbial loads in deep tissues. The Th17 cell dysregulation and bacterial dysbiosis were linked to impaired anti-microbial intestinal IgA responses, related to defective MyD88 adaptor- and Stat3 transcription factor-dependent T follicular regulatory and helper cell differentiation in the Peyer's patches. These findings establish an essential role for MyD88-dependent microbial sensing by Treg cells in enforcing mucosal tolerance and maintaining commensalism by promoting intestinal Treg cell formation and anti-commensal IgA responses.


Figures

Figure 1
Figure 1. Treg cell-specific MyD88 deletion results in gut mucosa Treg cell deficiency
A. Flow cytometric analysis of CD4+Foxp3+ Treg cells in the cLP of Myd88fl/fl and Foxp3EGFPcreMyd88Δ/Δ mice. B. Frequencies and absolute numbers of Treg cells in different tissues of Myd88fl/fl and Foxp3EGFPcreMyd88Δ/Δ mice. C, D. Flow cytometric analysis (C) and mean fluorescence intensity (MFI) (D) of CD25, CTLA-4, Helios, Nrp1, CD103 and Foxp3 cLP Treg cells of Myd88fl/fl and Foxp3EGFPcreMyd88Δ/Δ mice. E. Flow cytometric analysis of Foxp3 expression in cLP CD45.2+CD4+ T cells in CD45.1+ WT mice that received naïve CD45.2+CD4+Foxp3 T cells from OT-II+ Foxp3EGFPcre or OT-II+ Foxp3EGFPcreMyd88Δ/Δ mice and were then fed OVA in the drinking water for 1 week. F. Frequencies (left panel) and absolute numbers (right panel) of donor CD45.2+CD4+EGFP+ iTreg in the cLP of recipient mice from panel (E). G. Absolute numbers of donor CD45.2+CD4+Foxp3EGFP+ iTreg in the MLN of recipient mice. H. Methylation status of individual CpG motifs within the Foxp3 CNS2 in cLP Treg cells of Foxp3EGFPcre and Foxp3EGFPcreMyd88Δ/Δ mice. Individual CpG motifs are numbered with reference to the transcription initiation site of Foxp3. I. Global methylation status of Foxp3 CNS2 in splenic and cLP Treg cells shown in H. Results are representative of 4 independent experiments. N=3-8 mice/group. *p<0.05; **p<0.01; ***p<0.001 by Student’s unpaired two tailed t test and One-way ANOVA.
Figure 2
Figure 2. Treg cell-specific MyD88 deletion results in colonic Th17 skewing
A, B. Flow cytometric analysis (A) and enumerated cell frequencies and numbers (B) of cLP RORγ-t+CD4+Foxp3+Treg cells in Myd88fl/fl and Foxp3EGFPcreMyd88Δ/Δ mice. C. Real time PCR analysis of Rorc expression in cell-sorted cLP CD4+Foxp3+ Treg cells. D-I. Analysis of GATA3 expression and Gata3 mRNA (D-F) and IL-10 expression and Il10 mRNA (G-I) in cLP CD4+Foxp3+ Treg cells of the respective mouse strain, performed as in A-C. J, K. Expression of IL-17 and IFN-γ in cLP CD4+Foxp3 T cells of Myd88fl/fl and Foxp3EGFPcreMyd88Δ/Δ mice. Flow cytometric analysis (J), frequencies and absolute numbers (K) of cytokine expressing cells. L, M. Flow cytometric analysis (L), and frequencies and absolute numbers (M) of cLP CD4+Foxp3RORγ-t+ T cells of the respective mouse strain. N. Frequencies (left panel) and total cell number (right panel) of cLP CD4+Foxp3T-bet+ of Foxp3EGFPcreMyd88Δ/Δ mice compared with Myd88fl/fl control mice. Results are representative of 4 independent experiments. N=4-7 mice/group. *p<0.05; **p<0.01; ***p<0.001 by Student’s unpaired two tailed t test.
Figure 3
Figure 3. Treg cell-specific MyD88 deficiency aggravates the severity of experimental colitis
A. Survival curves of the following mouse groups treated with 5% DSS for 5 days then followed thereafter: 1) Myd88fl/fl, 2) Foxp3EGFPcreMyd88Δ/Δ and 3, 4) Foxp3EGFPcreMyd88Δ/Δ mice that were given cell-sorted CD4+EGFP+ splenic Treg cells from either Foxp3EGFPcre (MyD88-sufficient) or Foxp3EGFPcreMyd88Δ/Δ (MyD88-defcient) mice. B. Body weight loss following treatment of mouse groups as in panel A with 3.5% DSS for 5 days. C. Colon length and histological scores of the respective mouse groups in (B) at day 9 post DSS treatment. D-I. Flow cytometric analysis and frequencies of total and IL-10+ CD4+Foxp3+ Treg cells (D-F) and IFN-γ and IL-17 secreting CD4+Foxp3 Tconv cells (G-I) isolated from the cLP of the respective mouse groups in (B, C) at day 9 post DSS treatment. J-M. Groups of Foxp3EGFPcre and Foxp3EGFPcreMyd88Δ/Δ mice were subjected to DSS-induced colitis and treated with either isotype control or neutralizing anti-IL-17A mAbs at days 0, 2, and 4 of DSS treatment. J. Colon histology (Hematoxylin and eosin staining; 40× magnification). Body weight loss (K), colon length and clinical score (L) of the respective mouse groups. M. Frequencies and absolute numbers of IL-17 and IFN-γ secreting cLP CD4+Foxp3 Tconv cells of the respective mouse groups. Results are representative of 3 independent experiments. N =9-10 mice/group for panel A; **p<0.01 by log rank test. N= 4-7 mice/group for panels B-M; *p<0.05; **p<0.01; ***p<0.001 by One-way ANOVA.
Figure 4
Figure 4. Treg cell-specific MyD88 deficiency impairs PP Tfr and Tfh cell differentiation and intestinal IgA production
A-D. Flow cytometric analysis, frequencies and absolute numbers of Tfh cells (CD4+CXCR5+PD-1high) (A), CXCR5+IL-21+ cells within the Tfh populations (B), Tfr cells (CD4+Foxp3+CXCR5+PD-1high) (C) and IgA+B220+ B cells (D) in PP of Foxp3EGFPcreMyd88Δ/Δ and Myd88fl/fl mice. E. Serum and intestinal lavage fluid concentrations of IgA (I) and IgG, IgG1 and IgG2a (J) in Foxp3EGFPcreMyd88Δ/Δ and Myd88fl/fl mice. F-H. Flow cytometric analysis, and frequencies and absolute numbers of Tfh (F), Tfr (G) and IgA+B220+ (H) cells isolated from the PP of Tcra−/− mice 2 weeks following the transfer of CD4+EGFP+Treg cells isolated from either Foxp3EGFPcre or Foxp3EGFPcreMyd88Δ/Δ. I. Luminal concentration of IgA and IgG1 in the mouse groups from panel (H). Results are representative of 3 independent experiments. N=3-5 mice/group. *p<0.05; **p<0.01; by Student’s unpaired two tailed t test.
Figure 5
Figure 5. TR-cell specific MyD88 deficiency promotes dysbiosis and and bacterial translocation to deep tissues
A. Flow cytometric analysis and frequencies of IgA- and IgG1-coated bacteria in the fecal pellets of Rag1−/−, Foxp3EGFPcreMyd88Δ/Δ and MyD88fl/fl mice. B. OVA-specific luminal IgA and IgG1 concentrations in mice (panel A) gavaged with OVA-DH5α bacteria. C. Weighted Unifrac plot of ileal mucosa-associated microbial communities, visualized with principal coordinate analysis (PCoA), in Foxp3EGFPcreMyd88Δ/Δ versus Myd88fl/fl mice (p-value = 0.001 by AMOVA). D. Relative abundance of different microbial phyla in ileal mucosa-associated microbiota in Foxp3EGFPcreMyd88Δ/Δ and Myd88fl/fl mice (*false discovery rate<0.05). E. Relative abundance of SFB taxa in illeal mucosa-associated microbiota in Foxp3EGFPcreMyd88Δ/Δ and Myd88fl/fl mice. F. Real time PCR analysis of SFB 16S rRNA in IgA+ and IgA fecal bacterial fractions of Myd88fl/fl and Foxp3EGFPcreMyd88Δ/Δ mice. G. Stool (left panel) and liver (right panel) OVA-DH5α bacterial load [expressed as log colony forming units (lg CFU)/g] in Foxp3EGFPcreMyd88Δ/Δ and Myd88fl/fl mice treated with the OVA-DH5α bacteria by oral gavage. H. Loads of total bacteria, Lactobacilli and Pasteurella (all expressed as CFU/g tissue) in the lung and liver of Myd88fl/fl and Foxp3EGFPcreMyd88Δ/Δ mice. Results are representative of 3 independent experiments. Results representative of 3 independent experiments. N=5 mice/group. *p<0.05; **p<0.01; by Student’s unpaired two tailed t test.
Figure 6
Figure 6. Adoptive transfer of IgA+ PP B cells restores intestinal IgA production and inhibits Th17 skewing in Foxp3EGFPcreMyd88Δ/Δ recipients
A. Flow cytometric analysis and frequencies of CD45.1+B220+IgA+ and CD45.1+B220+IgG+ B cells found in the PP of Myd88fl/fl and Foxp3EGFPcreMyd88Δ/Δ recipients 2 weeks following their adoptive transfer. B. Serum and intestinal IgA (upper panels) and IgG1 (lower panels) concentrations in sham treated Myd88fl/fl and Foxp3EGFPcreMyd88Δ/Δ mice and in Foxp3EGFPcreMyd88Δ/Δ mice that received CD45.1+B220+IgA+ and CD45.1+B220+IgG+ B cells. C, D. Flow cytometric analysis (C), frequencies and absolute numbers (D) of IL-17 and IFN-γ -expressing cLP CD4+Foxp3 Tconv cells in the mouse groups described in (B). E, F. Absolute numbers of Treg cells in the cLP (E) and Tfr cells in the PP (F) in mouse groups outlined in (B). G. Real time PCR analysis of SFB 16S rRNA in the fecal pellets of the respective mouse groups. H. Translocation of gavaged DH5α bacteria into livers of mice of the respective mouse groups. Results representative of 3 independent experiments. N=3-5 mice/group. *p<0.05; **p<0.01; ***p<0.001 by Student’s unpaired two tailed t test and one-way ANOVA.
Figure 7
Figure 7. Treg cell-specific MyD88 signaling activates Stat3 and its deficiency is phenocopied by TR-cell specific Stat3 deficiency
A-I. TLR1-2-mediated activation of p65-NF-κB, Stat3 and Stat5 in Myd88fl/fl and Foxp3EGFPcreMyd88Δ/Δ cLP CD4+Foxp3+Treg cells. A, D, G. Flow cytometric analysis of p-p65-NF-κB (A), pStat3 (D) and pStat5 (G) in cLP CD4+Foxp3+Treg cells treated with either PBS or the TLR1-2 ligand (TLR1-2-L) Pam3SCK4. (B, E, H) MFI of the respective phosphoprotein. (C, F, I). Chromatin immunoprecipitation (ChIP) assay of NF-κB p65, Stat3 and Stat5 bound to the Foxp3-CNS2 in the respective cLP CD4+Foxp3+Treg cells treated with either PBS, TLR1-2-L (for p65-NF-kB and Stat3 ChIP) or IL-2 (for Stat5 ChIP). J-O. WT and Foxp3EGFPcreStat3Δ/Δ mice were either untreated or received adoptively transferred CD45.1+B220+IgA+ or CD45.1+B220+IgG+ PP B cell derived from CD45.1+ WT donor mice. Analysis was carried out 2 weeks following the B cell transfer. J. Frequencies of total B220+IgA+ in the PP. K. Intestinal lavage fluid IgA and IgG concentrations. L, M. Frequencies of PP Tfr and cLP Treg cells, respectively. N. Frequencies of CD4+IL-17+ and CD4+IFN-γ+ Tconv cells. O. Real time PCR analysis of SFB 16S rDNA in the stool. Similar results were obtained in 2 independent experiments. N= 4-7 /group *P<0.05; **P<0.01, ***P<0.001 by One-way ANOVA.

Similar articles

Cited by

References

    1. Atarashi K, Tanoue T, Shima T, Imaoka A, Kuwahara T, Momose Y, Cheng G, Yamasaki S, Saito T, Ohba Y, et al. Induction of colonic regulatory T cells by indigenous Clostridium species. Science. 2011;331:337–341. - PMC - PubMed
    1. Backhed F, Ley RE, Sonnenburg JL, Peterson DA, Gordon JI. Host-bacterial mutualism in the human intestine. Science. 2005;307:1915–1920. - PubMed
    1. Caramalho I, Lopes-Carvalho T, Ostler D, Zelenay S, Haury M, Demengeot J. Regulatory T cells selectively express toll-like receptors and are activated by lipopolysaccharide. J Exp Med. 2003;197:403–411. - PMC - PubMed
    1. Chaudhry A, Rudra D, Treuting P, Samstein RM, Liang Y, Kas A, Rudensky AY. CD4+ regulatory T cells control TH17 responses in a Stat3-dependent manner. Science. 2009;326:986–991. - PMC - PubMed
    1. Chaudhry A, Samstein RM, Treuting P, Liang Y, Pils MC, Heinrich JM, Jack RS, Wunderlich FT, Bruning JC, Muller W, Rudensky AY. Interleukin-10 signaling in regulatory T cells is required for suppression of Th17 cell-mediated inflammation. Immunity. 2011;34:566–578. - PMC - PubMed

Publication types

MeSH terms